- A+
一、 说明
本文主要将prometheus和consul 结合起来使用,通过conusl 注册服务至prometheus,实现服务统一注册,统一报警管理等。
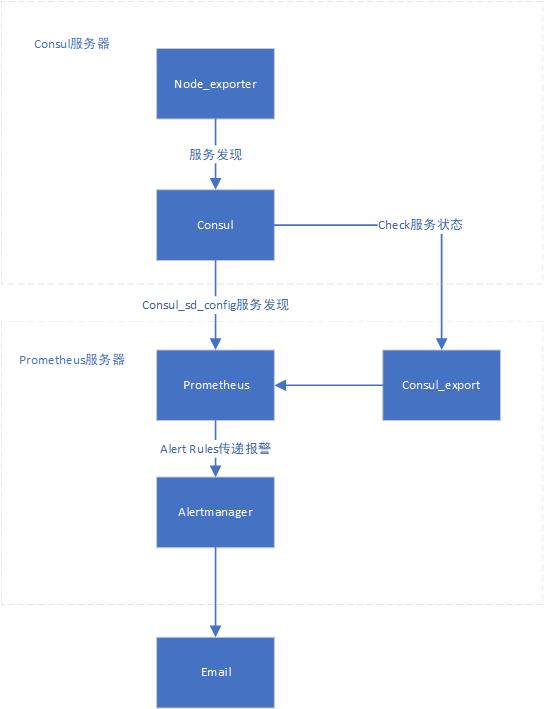
整个架构思路consul+consul_export+prometheus+alertmanager ,consul通过check检测服务状态,然后通过consul_export暴露给prometheus,prometheus通过alert规则,通知alertmanager,接着邮件通知管理人员。
在各服务器上安装node_expoert,然后将node配置到consul的hcl服务文件中,进行服务注册,当然也可以http api发现。然后在prometheus主yml文件中配置consul_sd_configs对服务进行发现。
单台架构如下。
本次server服务器有3台,组建consul集群,全部用做server端,然后在每一台都部署node_expoerter作为prometheus node节点。
IP规划如下:
172.19.100.212(prometheus主服务器,理论上可以不部署node_expoerter),
172.19.100.213
172.19.100.52
二、consul集群搭建
2.1 consul安装
在每台服务器上安装consul。采用yum 安装,这也是我最推荐的方式。配置目录路径在/etc/consul.d。
yum install -y yum-utils yum-config-manager --add-repo https://rpm.releases.hashicorp.com/RHEL/hashicorp.repo yum -y install consul
2.2 集群文件配置
212服务器的配置如下。data_dir已经在默认的consul.hcl中有配置,所以注释掉了。其他两台服务器根据如下配置分别配置IP。systemct start consul启动consul即可。
server = true bootstrap_expect = 3 # data_dir = "/tmp/consul" node_name = "172.19.100.212" bind_addr = "172.19.100.212" client_addr = "0.0.0.0" ui_config = { enabled = true } enable_script_checks = true start_join = [ "172.19.100.213", "172.19.100.52" ] retry_join = [ "172.19.100.213", "172.19.100.52" ]
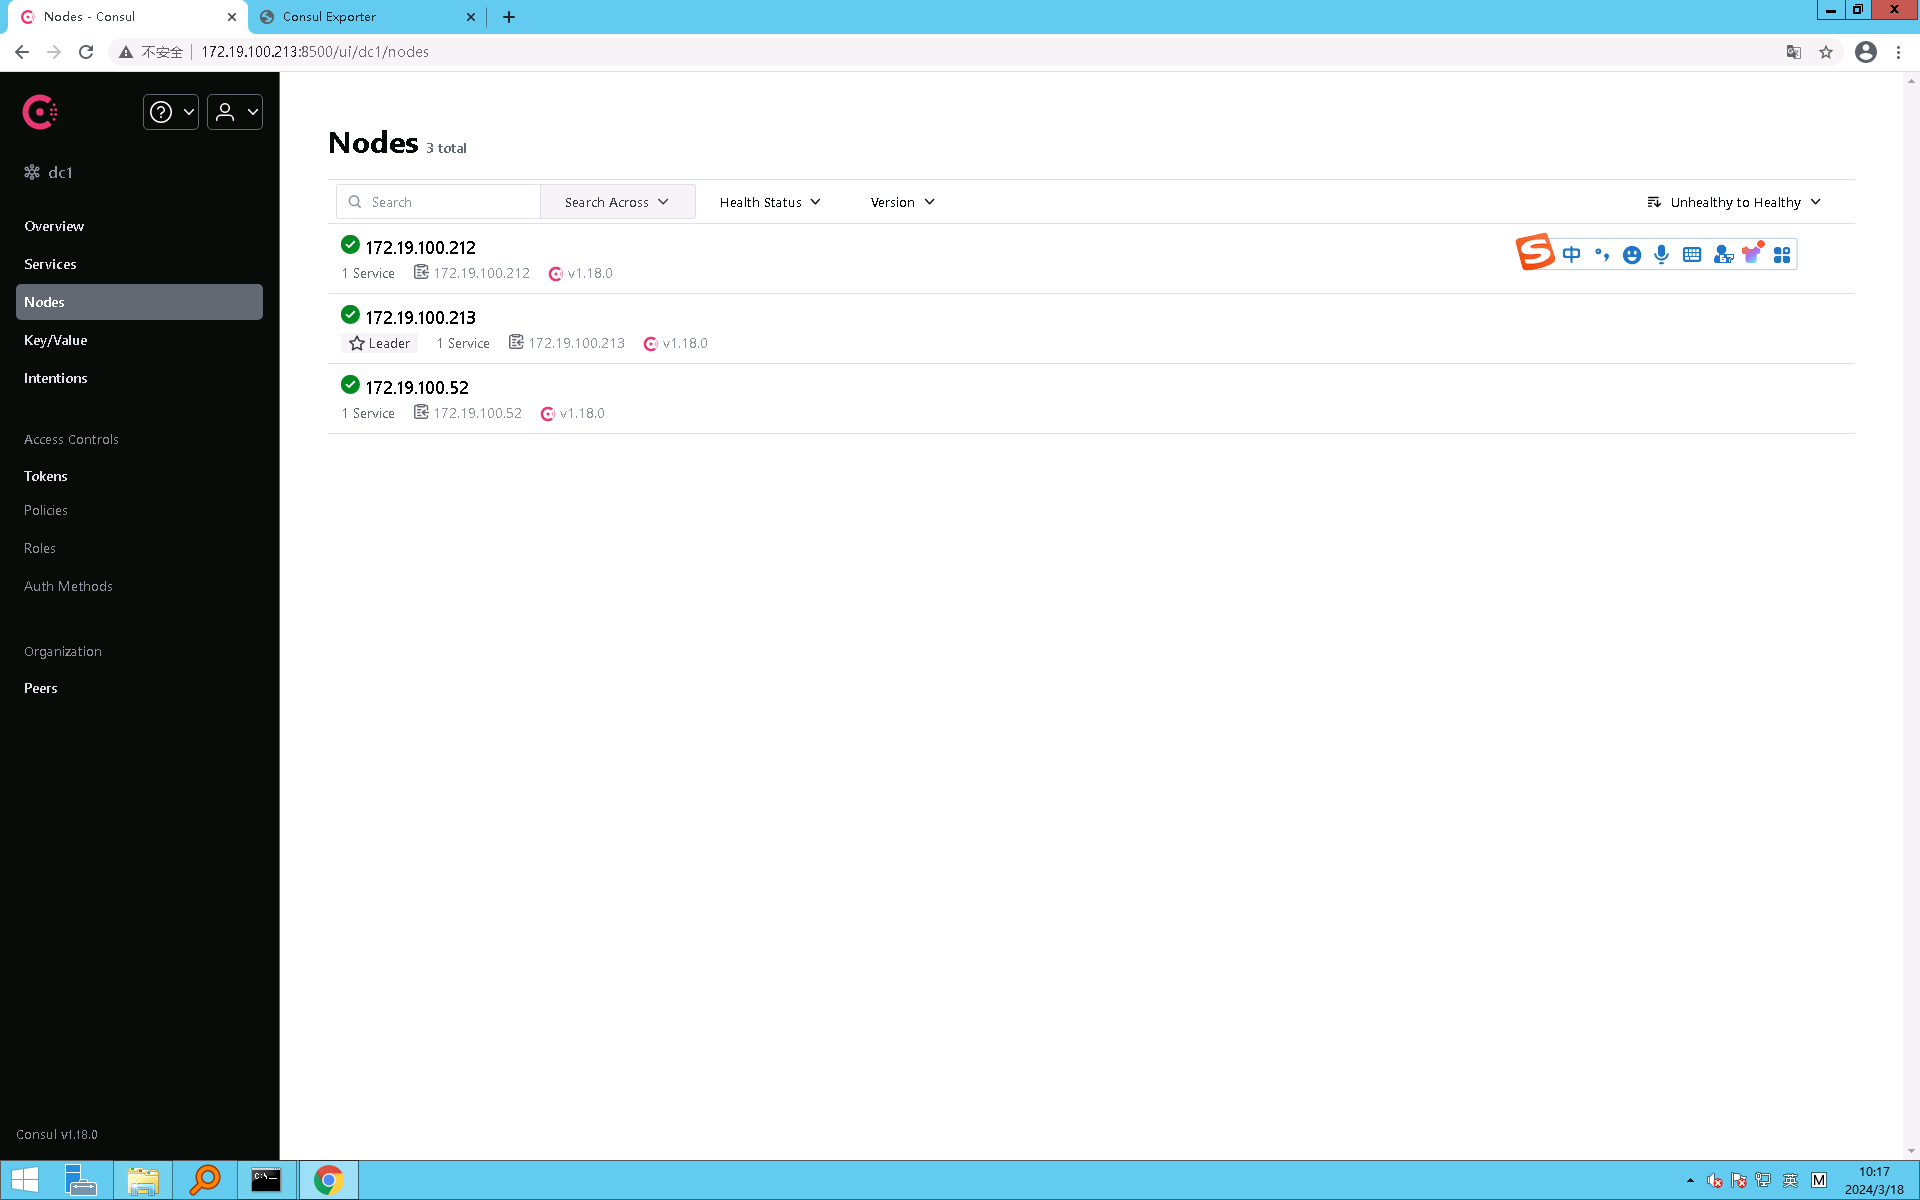
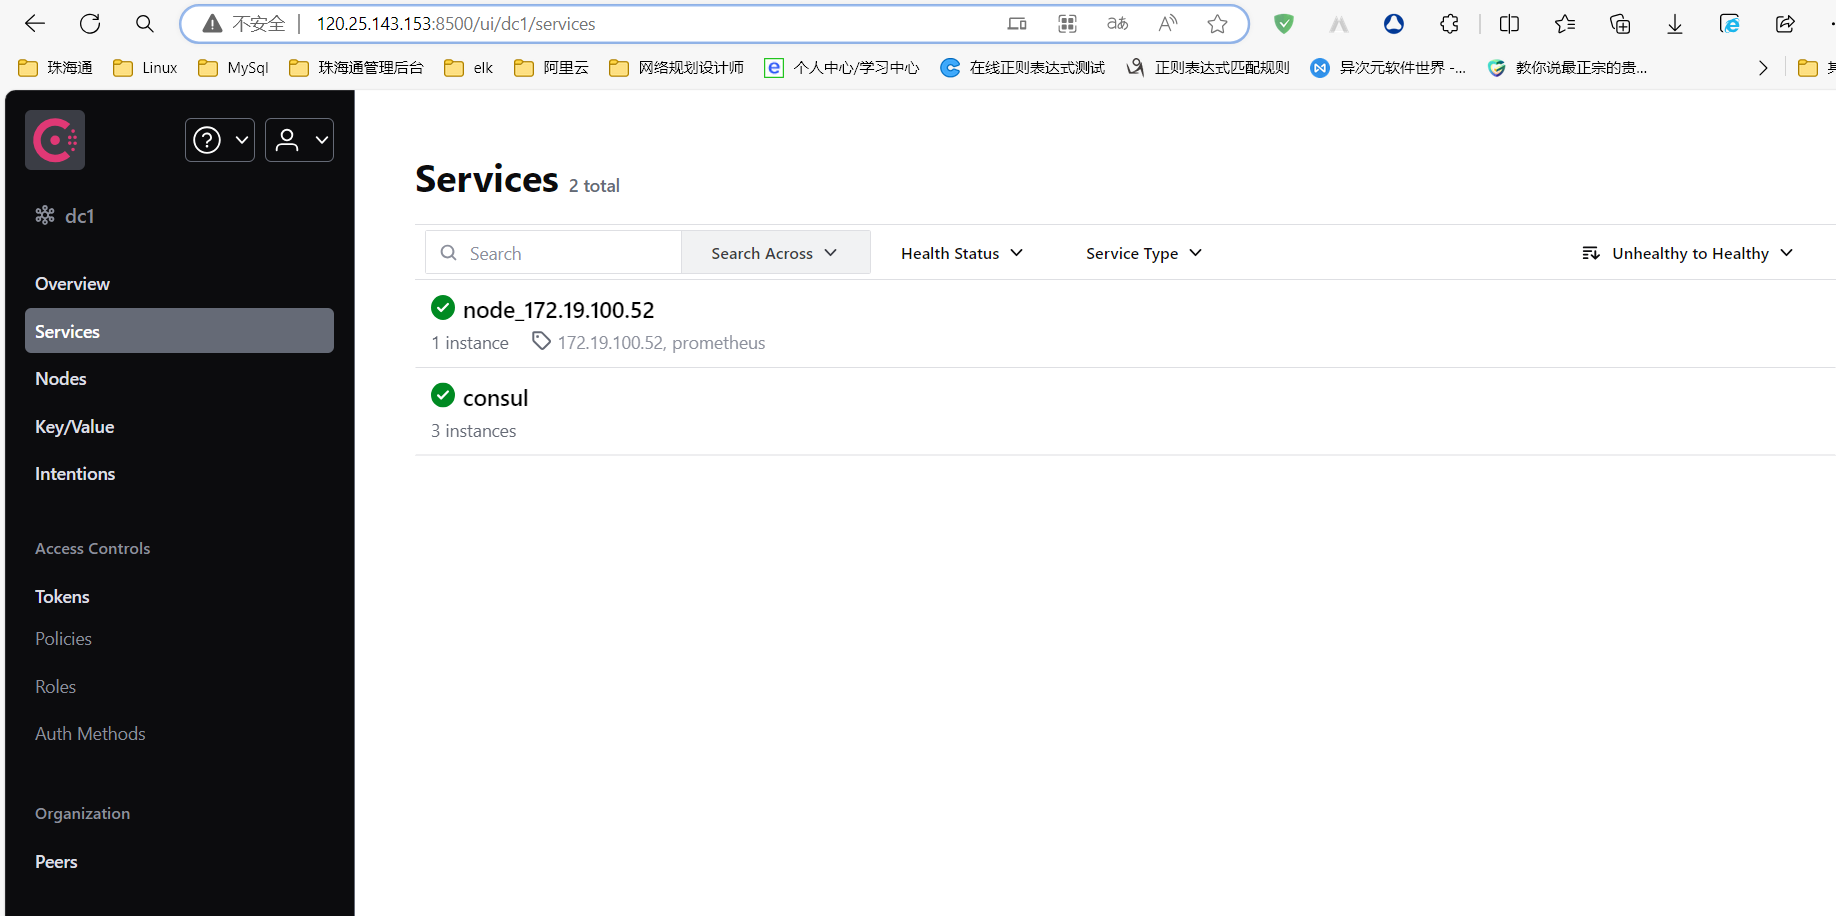
搭建好的集群如下:
2.3 consul_exporter安装
consul_exporter主要用于将consul的check 报警导出到prometheus ,这样在prometheus就不需要再次配置报警规则了。
下载地址:https://github.com/prometheus/consul_exporter/releases
当然如果需要额外的报警功能,可以通过blackbox_exporter配置,里边有很多报警模块。
consul_export 不需要额外的配置,三台直接安装后启动即可,后续在prometheus中配置三台的地址即可。目前我只在212服务器上安装了。
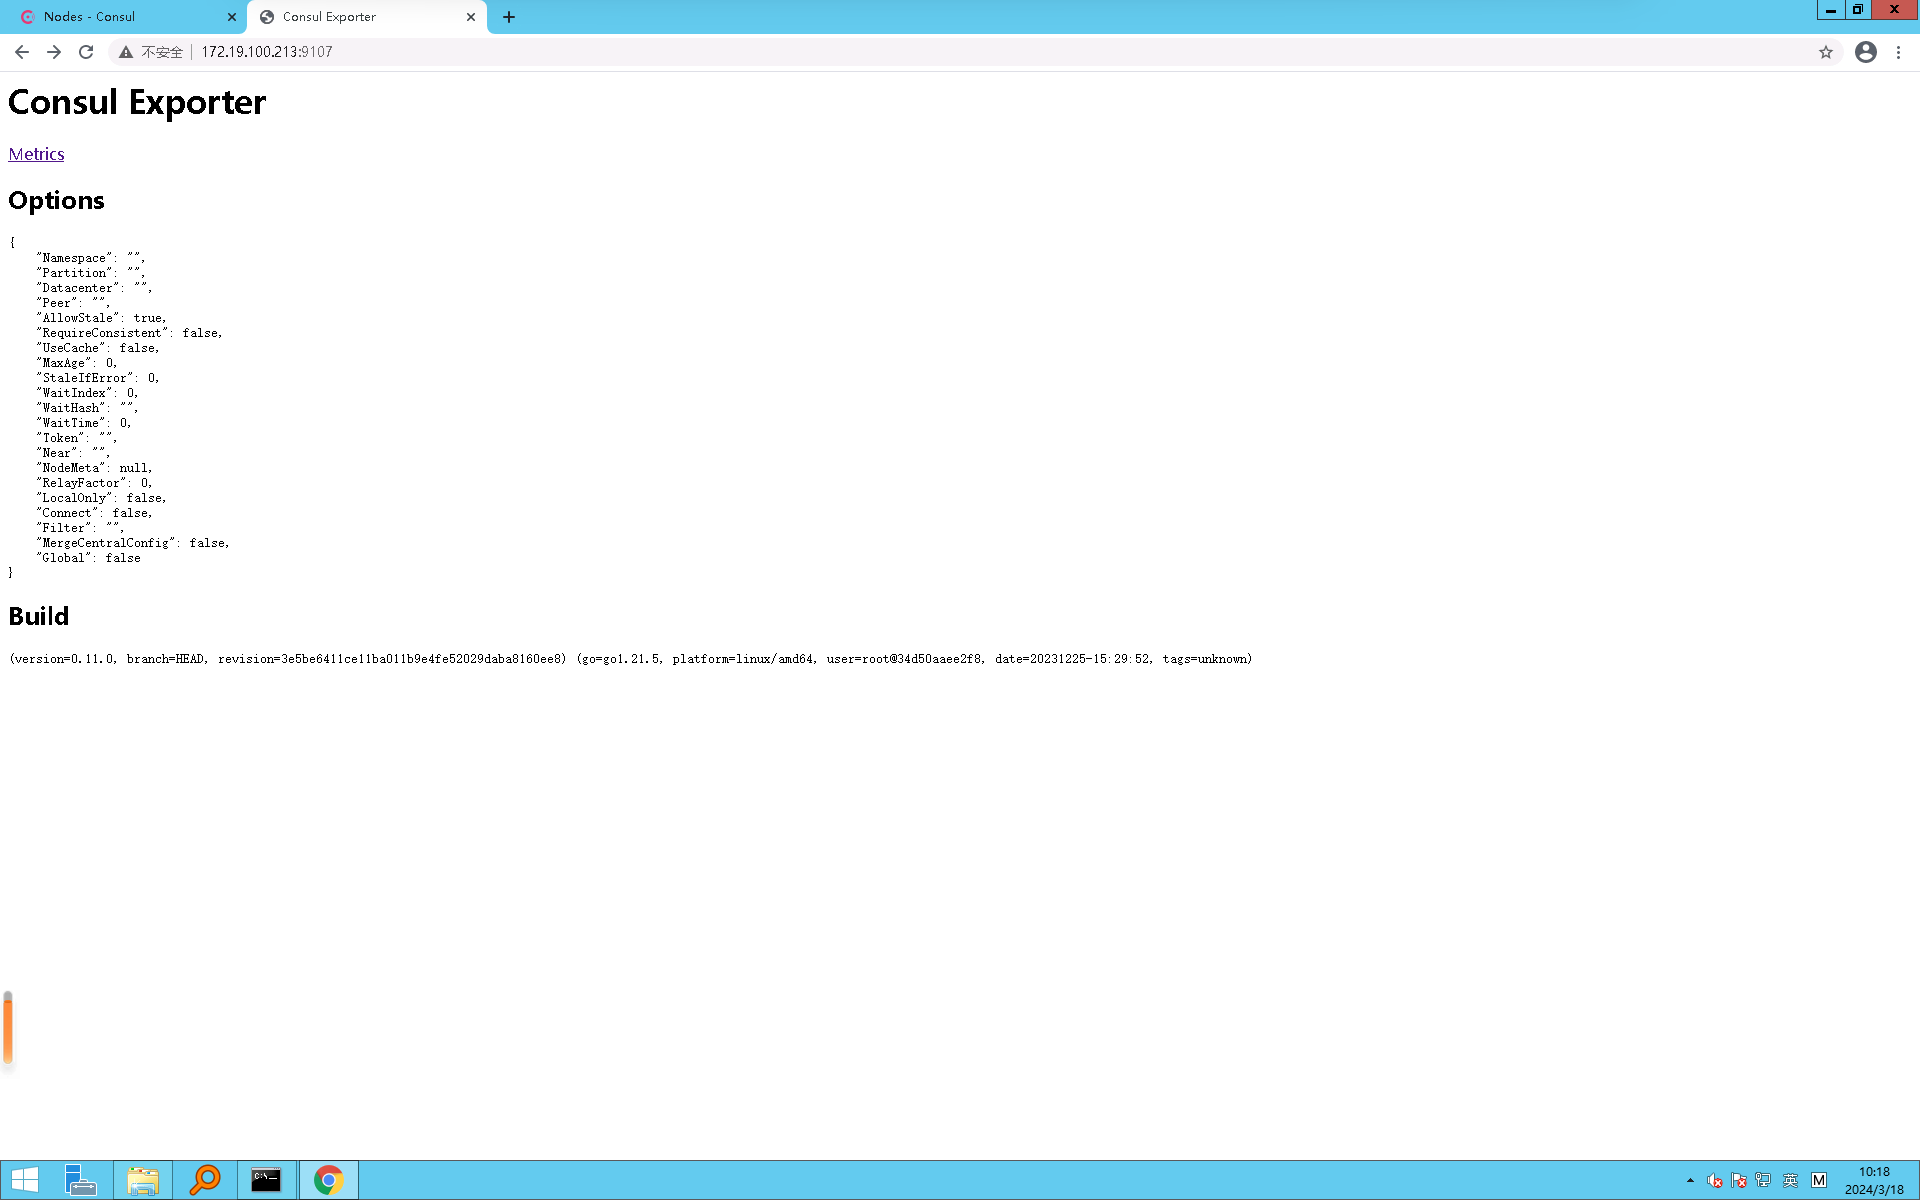
[root@zht-app001 opt]# tar -xzvf consul_exporter-0.11.0.linux-amd64.tar.gz consul_exporter-0.11.0.linux-amd64/ consul_exporter-0.11.0.linux-amd64/LICENSE consul_exporter-0.11.0.linux-amd64/consul_exporter consul_exporter-0.11.0.linux-amd64/NOTICE [root@zht-app001 opt]# cd consul_exporter-0.11.0.linux-amd64 [root@zht-app001 consul_exporter-0.11.0.linux-amd64]# ls consul_exporter LICENSE NOTICE [root@zht-app001 consul_exporter-0.11.0.linux-amd64]# nohup ./consul_exporter & [1] 11749 [root@zht-app001 consul_exporter-0.11.0.linux-amd64]# nohup: ignoring input and appending output to ‘nohup.out’ [root@zht-app001 consul_exporter-0.11.0.linux-amd64]# tail -f nohup.out ts=2024-03-18T02:07:50.153Z caller=consul_exporter.go:82 level=info msg="Starting consul_exporter" version="(version=0.11.0, branch=HEAD, revision=3e5be6411ce11ba011b9e4fe52029daba8160ee8)" ts=2024-03-18T02:07:50.153Z caller=consul_exporter.go:83 level=info build_context="(go=go1.21.5, platform=linux/amd64, user=root@34d50aaee2f8, date=20231225-15:29:52, tags=unknown)" ts=2024-03-18T02:07:50.154Z caller=tls_config.go:274 level=info msg="Listening on" address=[::]:9107 ts=2024-03-18T02:07:50.154Z caller=tls_config.go:277 level=info msg="TLS is disabled." http2=false address=[::]:9107
consul_exporter的可选配置如下,如果不配置都是默认的,consul的token我将在最后配置。配置命令如下:
export CONSUL_HTTP_TOKEN=<your_token_here>
2.4 consul token设置
三、prometheus 搭建
前往https://prometheus.io/download/ 下载最新的prometheus组件
3.1 node_exporter 安装 和注册
每一个conul (server/client)agent上都需要安装node_exporter,然后分别对node进行注册。
3.1.1 安装
我将文件下载到了/opt目录,然后将node_exporter配置为系统service;文件名为node_exporter.service,放置在/etc/systemd/system目录下:
配置如下:
[Unit] Description=Node Exporter for Prometheus After=network-online.target [Service] #User=<非特权用户,例如 node_exporter> ExecStart=/opt/node_exporter-1.7.0.linux-amd64/node_exporter #EnvironmentFile=-/etc/default/node_exporter # 如果有额外环境变量配置,可以在这里引用 Restart=on-failure RestartSec=5s [Install] WantedBy=multi-user.target
操作命令如下
systemctl daemon-reload systemctl start node_exporter.service systemctl status node_exporter.service systemctl enable node_exporter.service
状态如下
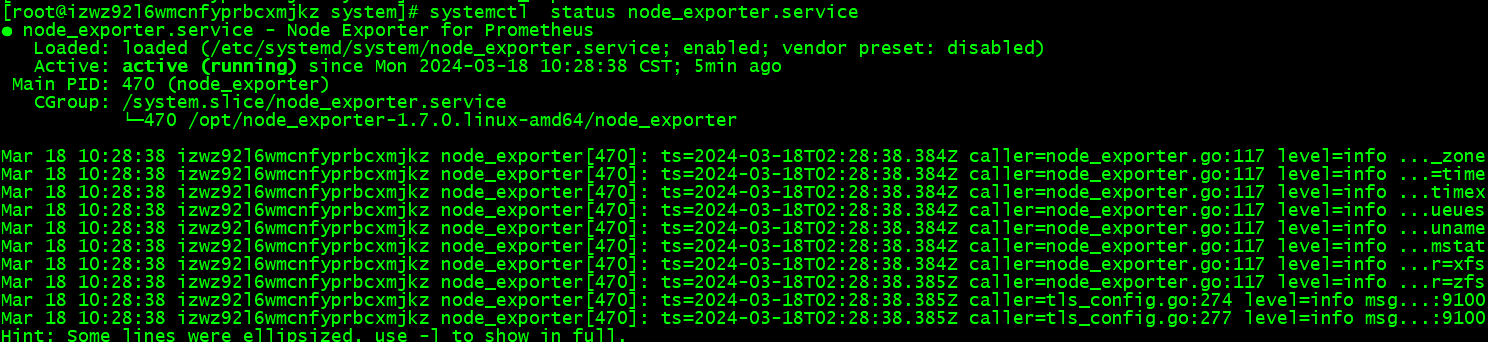
3.1.2 注册到consul
在consul配置文件夹下新建hcl文件即可,配置如下,其余服务器按照一样的操作进行。
[root@izwz92l6wmcnfyprbcxmjkz opt]# cd /etc/consul.d/ [root@izwz92l6wmcnfyprbcxmjkz consul.d]# ls consul.env consul.hcl server.hcl [root@izwz92l6wmcnfyprbcxmjkz consul.d]# vim node_exporter.hcl
Token在后续配置,配置好后,重新启动consul
services { name = "node_172.19.100.52" address = "172.19.100.52" id = "node_172.19.100.52" port = 9100 tags = ["prometheus","172.19.100.52"] #token = "d1e6d941-8577-1f27-dd7b-0d8ac9212ba5" checks { id = "node_172.19.100.52_tcp_check" name = "Node Exporter TCP Check" interval = "10s" timeout = "1s" tcp = ":9100" } }
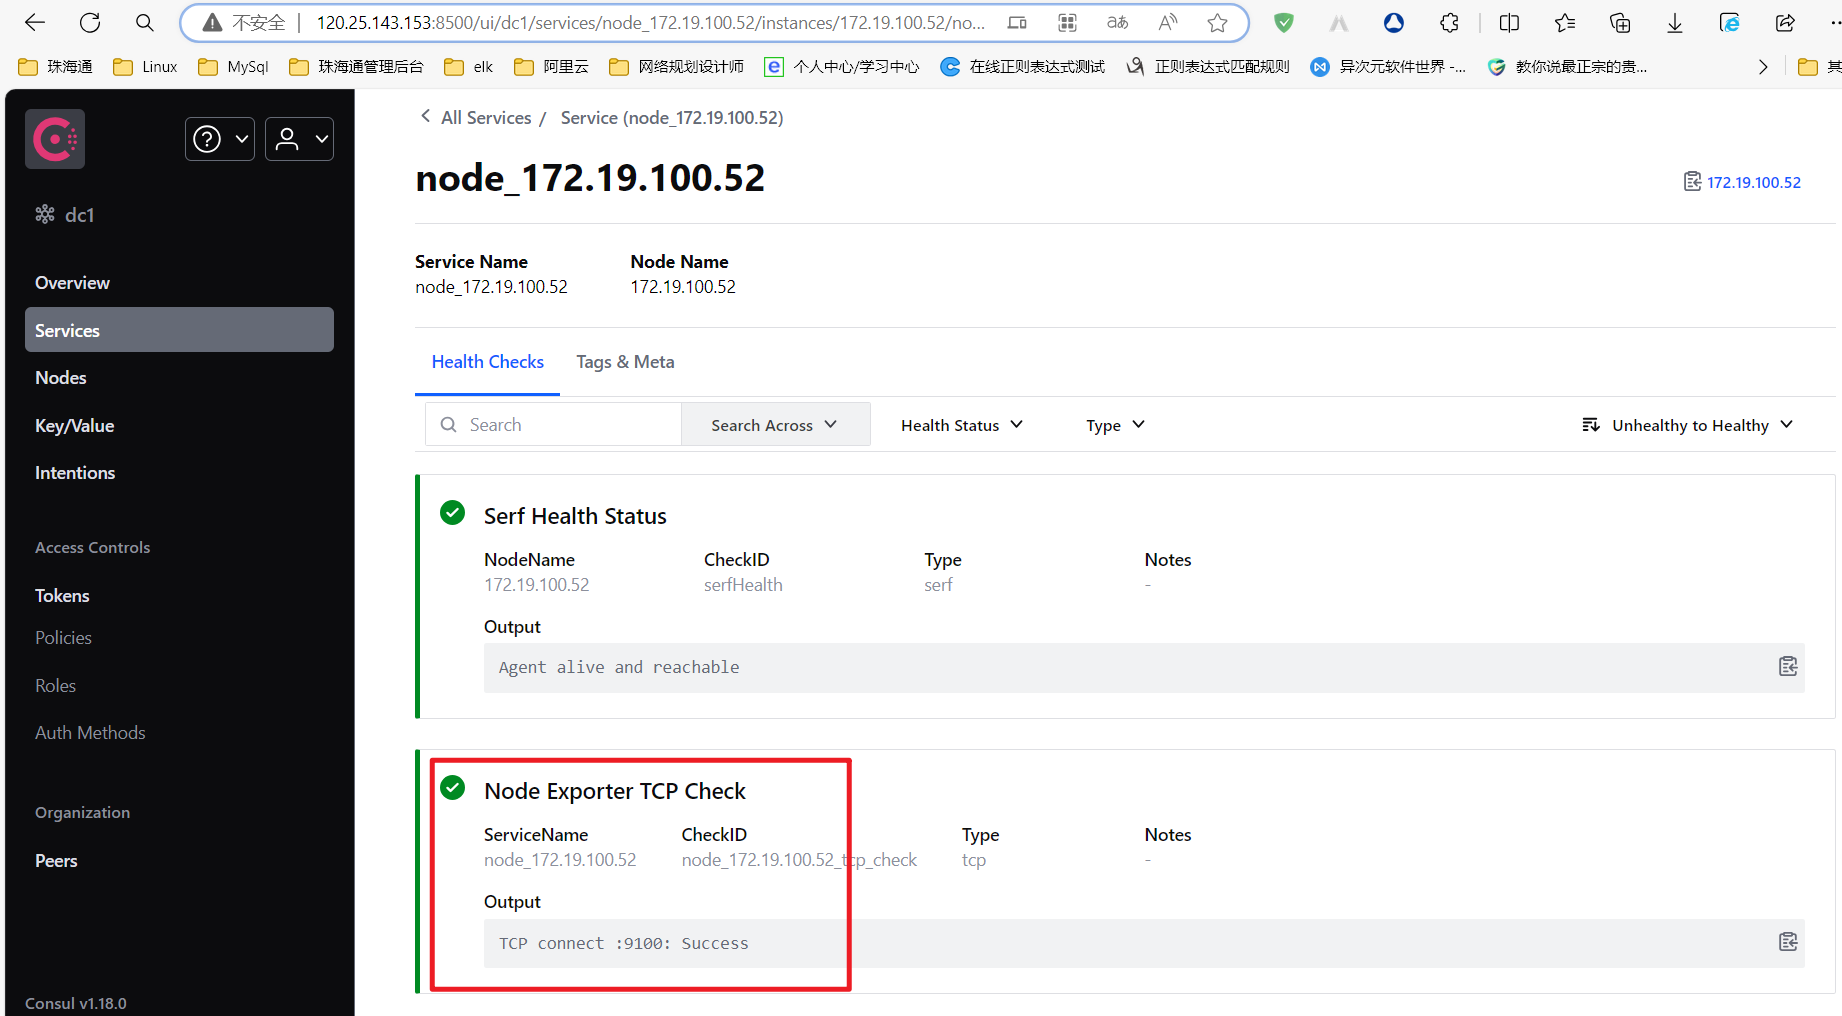
可以看到node注册成功,check检查成功,这个结果后续我们要通过consul_exporter传到至prometheus。
3.2 安装prometheus
将下载的tar.gz解下后,将prometheus配置成系统/etc/systemd/system/prometheus.service
[Unit] Description=Prometheus Monitoring System Documentation=https://prometheus.io/docs/introduction/overview/ After=network-online.target [Service] #User=prometheus #Group=prometheus ExecStart=/opt/prometheus-2.50.1.linux-amd64/prometheus --config.file=/opt/prometheus-2.50.1.linux-amd64/prometheus.yml Restart=always RestartSec=10s LimitNOFILE=4096 [Install] WantedBy=multi-user.target
sudo systemctl daemon-reload sudo systemctl start prometheus sudo systemctl status prometheus # 查看服务运行状态 sudo systemctl enable prometheus # 设置开机启动
3.3 配置consul_sd_config 和consul_exporter
在prometheus.yml配置如下,然后重启prometheus 即可
- job_name: "consul_export报警" static_configs: - targets: ["172.19.100.212:9107"] # 这里填写 Consul Exporter 监听的 IP 和端口 relabel_configs: [] # 根据需要重写标签 - job_name: "node_export服务发现" consul_sd_configs: - server: "172.16.100.212:8500" #token: "4489cdd3-1952-4ded-4eb9-07a823f5b2ff" #token: "3ce3c959-c9e5-7e2c-abe7-1fccbbfe01ae" tags: - "prometheus" relabel_configs: - source_labels: [__meta_consul_health] target_label: service_health_status
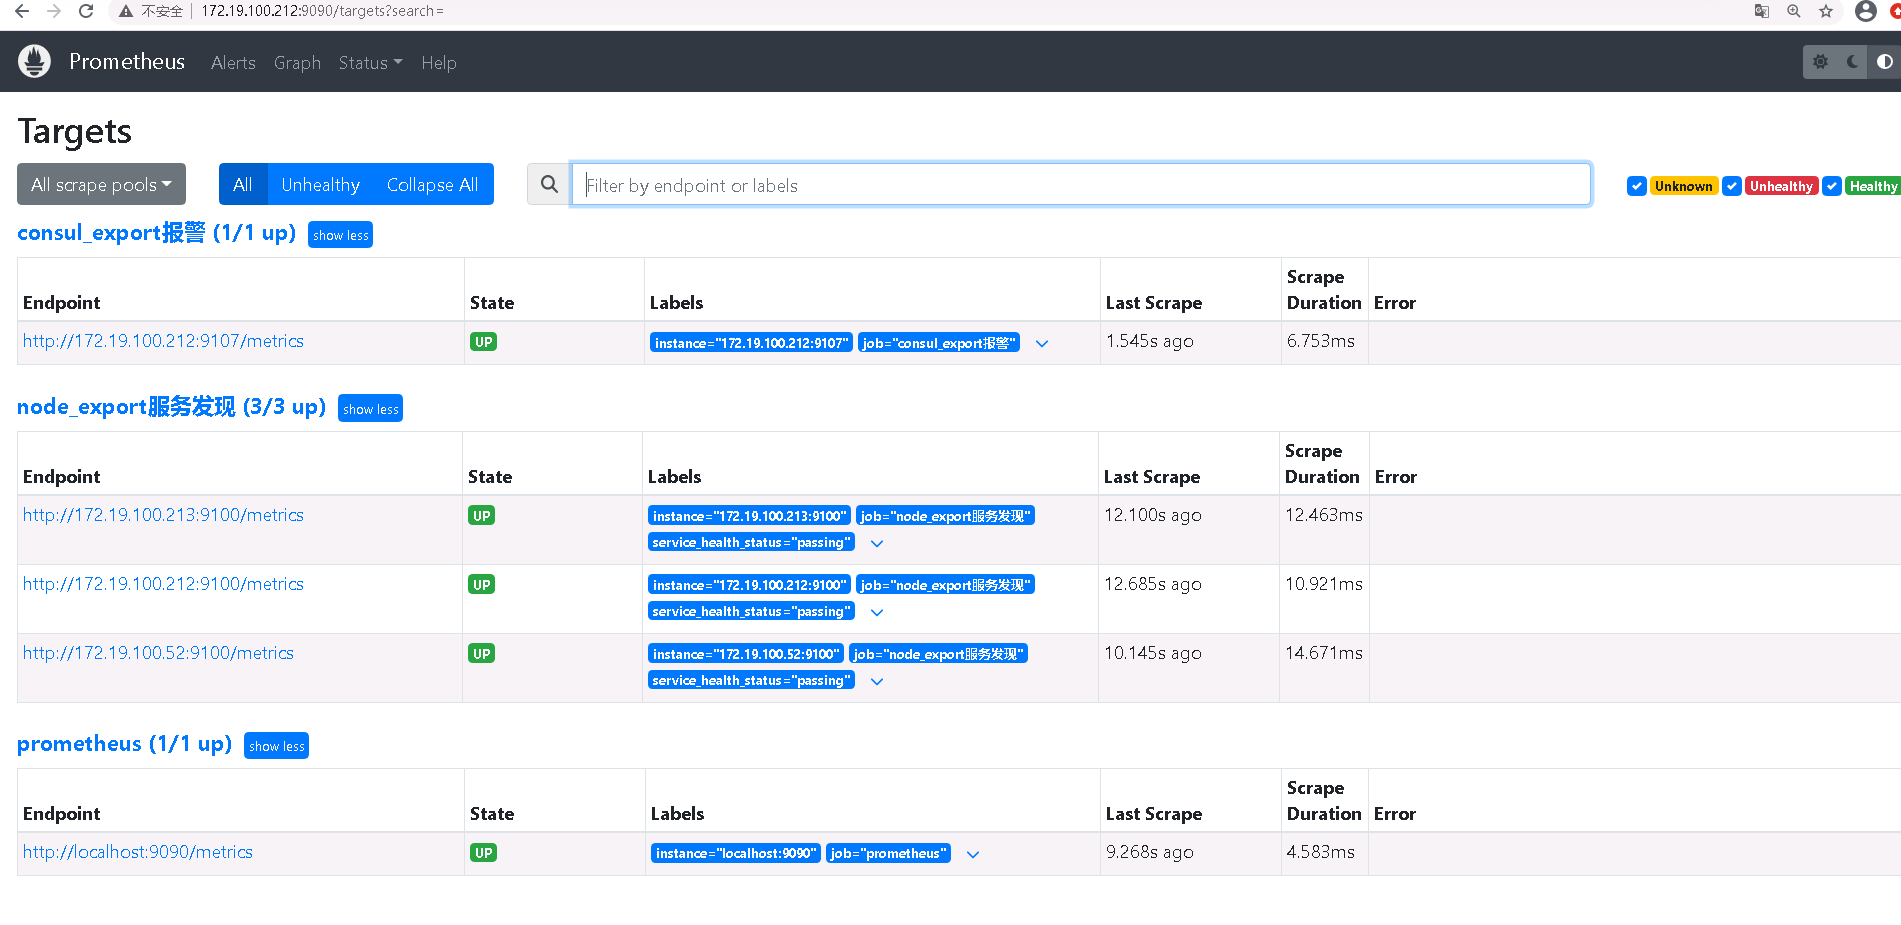
界面如图
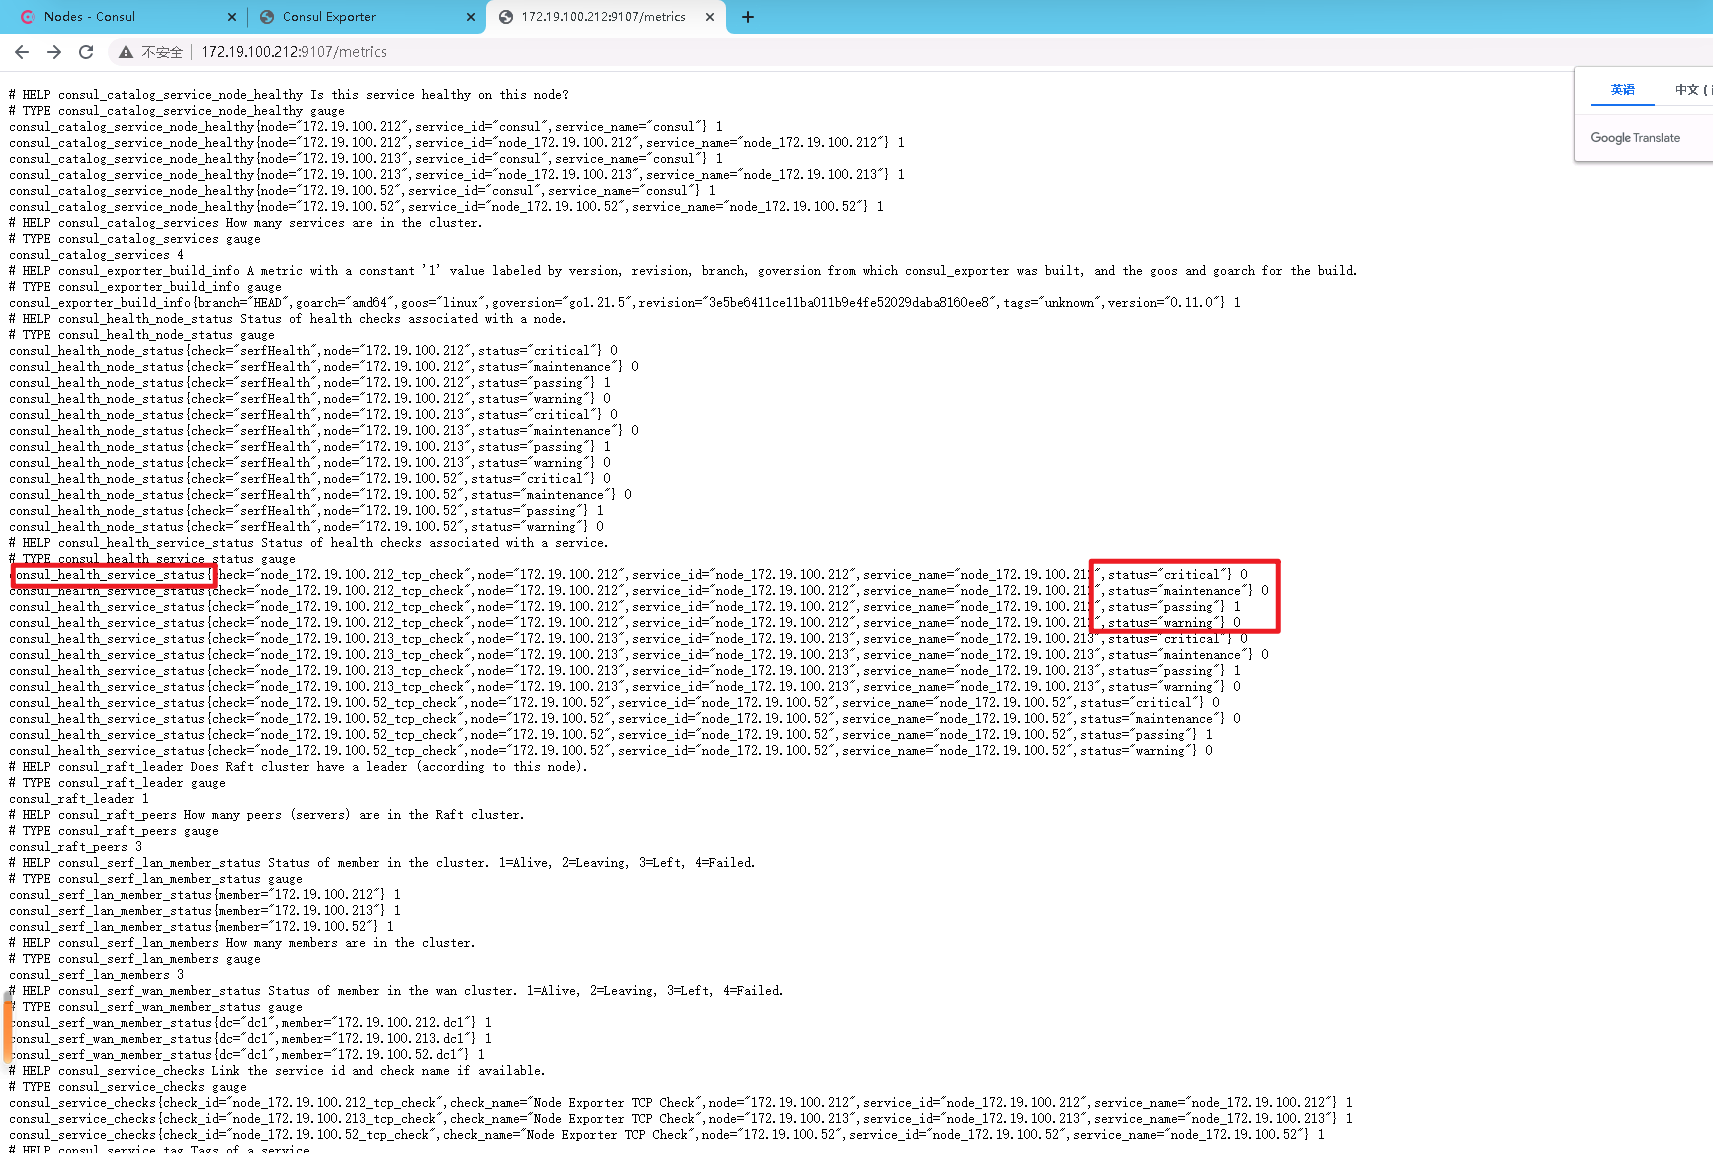
点击consul_exporter报警的endpoint的的界面如下,可以看到服务的check状态。我们可以根据这些状态编写rules进行报警。
3.4 rules 报警规则配置
需要先在prometheus.yml中加如下配置
rule_files: # - "first_rules.yml" # - "second_rules.yml" - "prometheus.rules.yml"
在prometheus.rules.yml配置如下,这是针对3.3中node的报警规则,一旦有匹配的expr,则会触发rules中的alert规则。而alert规则会直接传送到alertmanager里边查看默认的route,再决定下一步操作(比如发送邮件报警,或者发送到企业微信)。
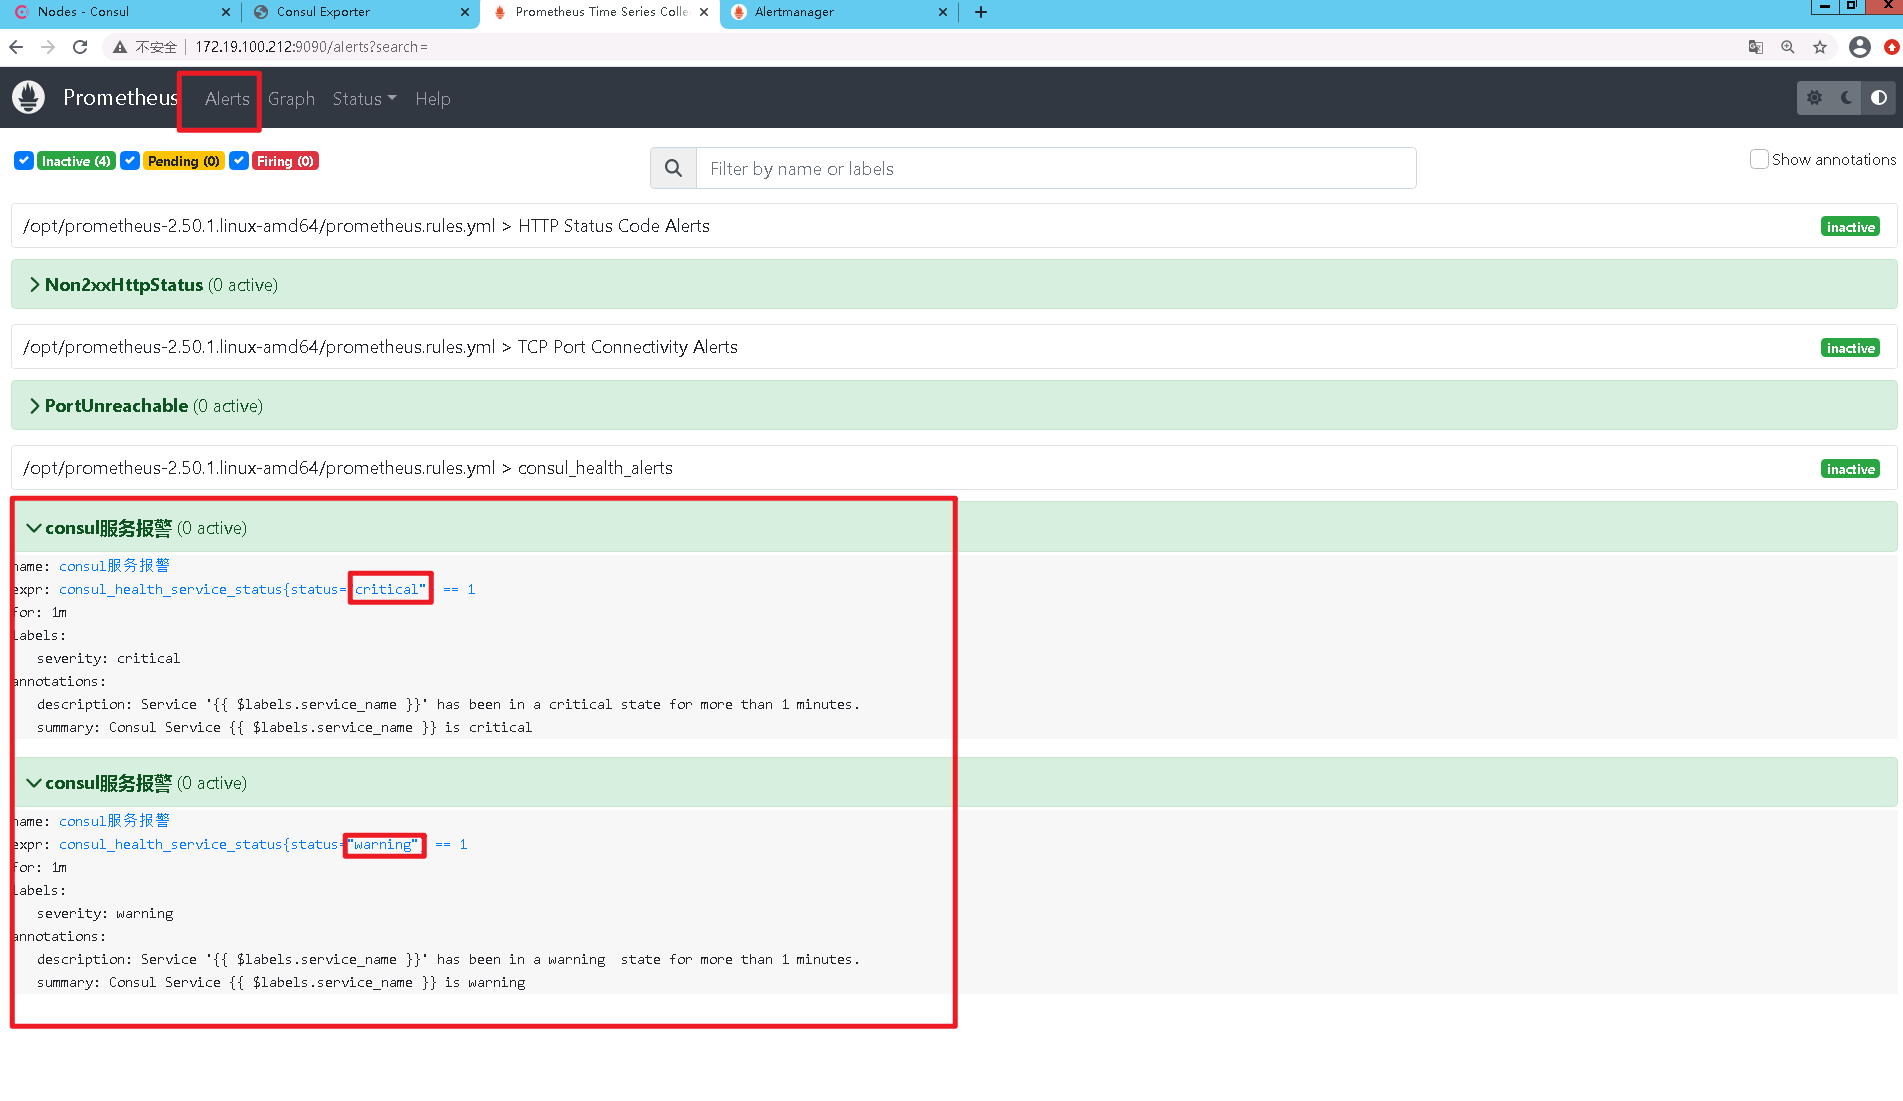
groups: #consu_export报警 - name: consul_health_alerts rules: - alert: "consul服务报警" expr: consul_health_service_status{status="critical"} == 1 # 1 表示critical状态 for: 1m # 可以根据实际情况调整这个时间窗口,比如持续5分钟未恢复才报警 labels: severity: critical annotations: summary: "Consul Service {{ $labels.service_name }} is critical" description: "Service '{{ $labels.service_name }}' has been in a critical state for more than 1 minutes." - alert: "consul服务报警" expr: consul_health_service_status{status="warning"} == 1 for: 1m # 可以根据实际情况调整这个时间窗口,比如持续5分钟未恢复才报警 labels: severity: warning annotations: summary: "Consul Service {{ $labels.service_name }} is warning" description: "Service '{{ $labels.service_name }}' has been in a warning state for more than 1 minutes."
这是prometheus的alert页面,显示的就是我上边配置的报警规则
3.5 alertmanager 配置
需要现在prometheus.yml中加入以下配置
# Alertmanager configuration alerting: alertmanagers: - static_configs: - targets: - localhost:9093
将tar.gz解压到/opt/,然后配置系统服务/etc/systemd/system/ alertmanager.service
[Unit] Description=Prometheus Alertmanager System After=network-online.target [Service] ExecStart=/opt/alertmanager-0.27.0.linux-amd64/alertmanager --config.file=/opt/alertmanager-0.27.0.linux-amd64/alertmanager.yml Restart=on-failure RestartSec=5s [Install] WantedBy=multi-user.target
systemctl daemon-reload systemctl start alertmanager.service systemctl status alertmanager.service systemctl enable alertmanager.service
alertmanager.yml配置如下,我通过QQ邮件进行报警。
global: resolve_timeout: 5m route: receiver: "email-receiver" receivers: - name: "email-receiver" email_configs: - send_resolved: true # 是否发送解决通知 to: "XXXXX" # 接收报警邮件的地址 from: "XXXXX " # 发送报警邮件的地址 smarthost: "smtp.qq.com:587" # SMTP服务器地址及端口 auth_username: "XXXXX" # SMTP用户名 auth_password: "XXXXX" # SMTP密码(如果是明文,推荐使用加密存储) require_tls: true # 如果SMTP服务器支持TLS,则启用 inhibit_rules: [] # 可选,抑制规则配置
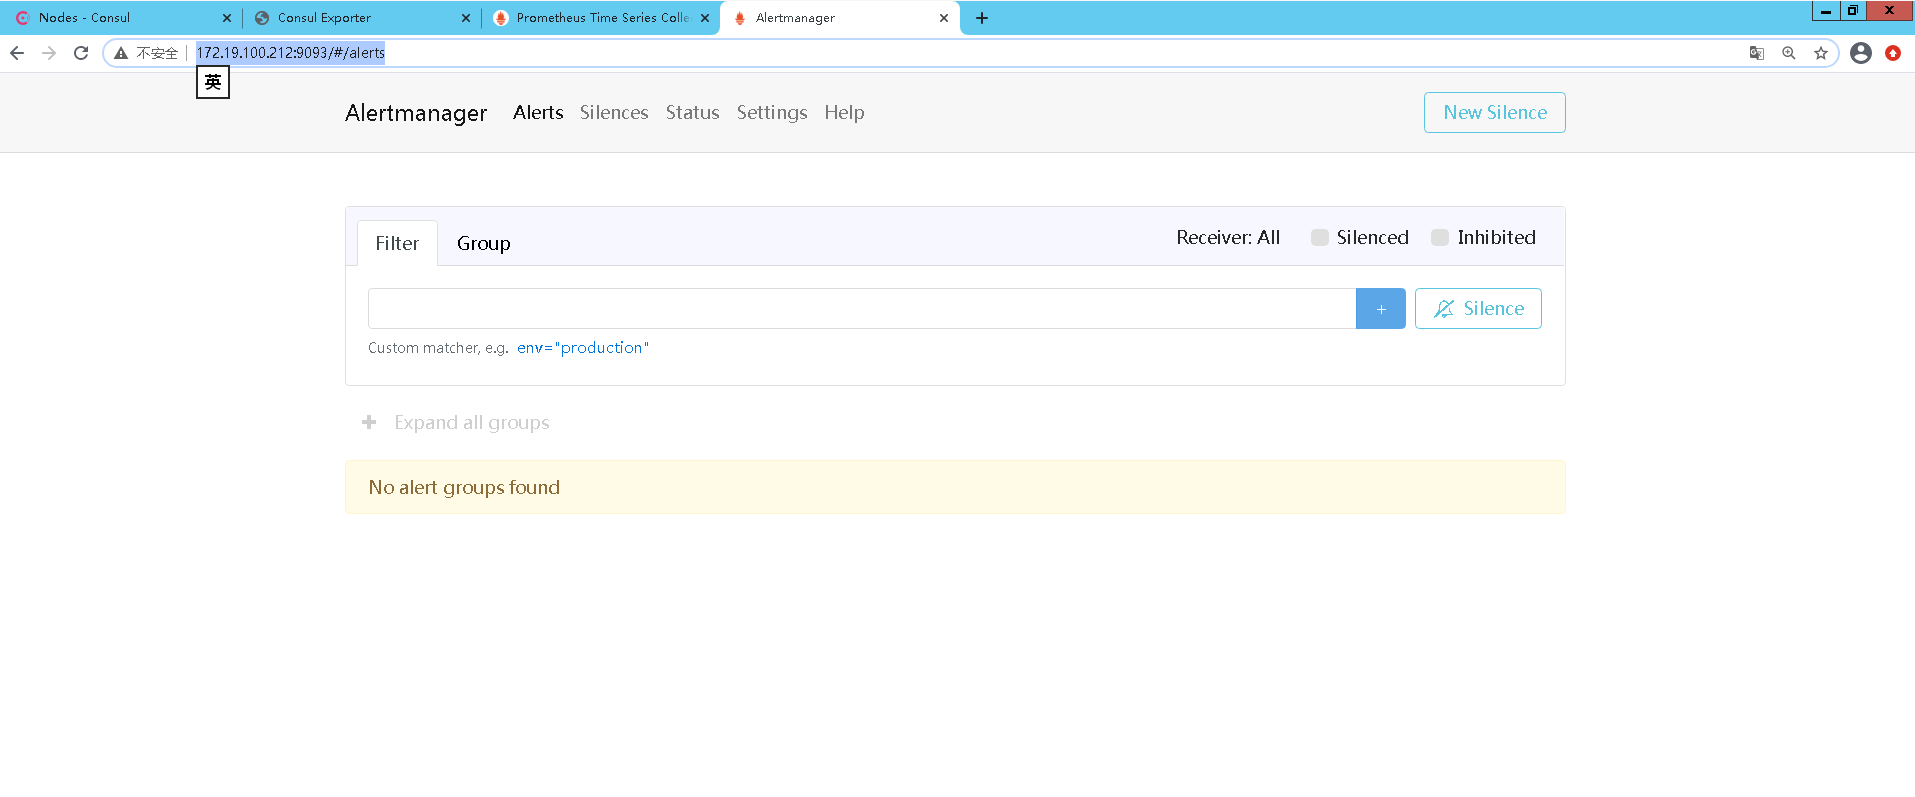
这是alertmanager页面,目前还没有报警,所以是空白的,下边我们来将其中一个node_export节点停掉,来观察一下报警。
3.6 报警演示
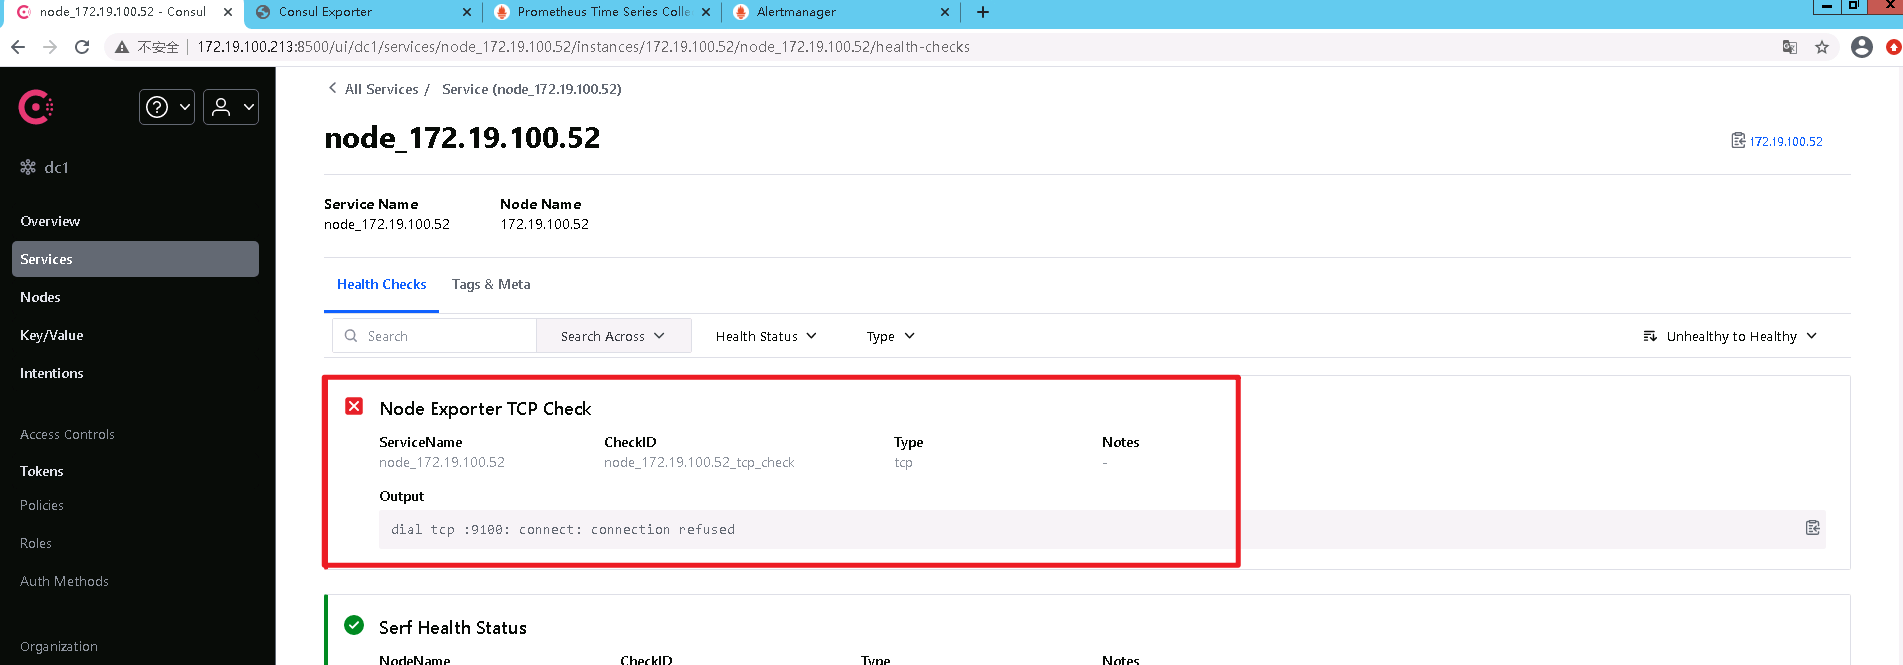
手动关闭52服务器上的node_exporter 服务 Systemctl stop node_exporter
1、consul最先check出报警
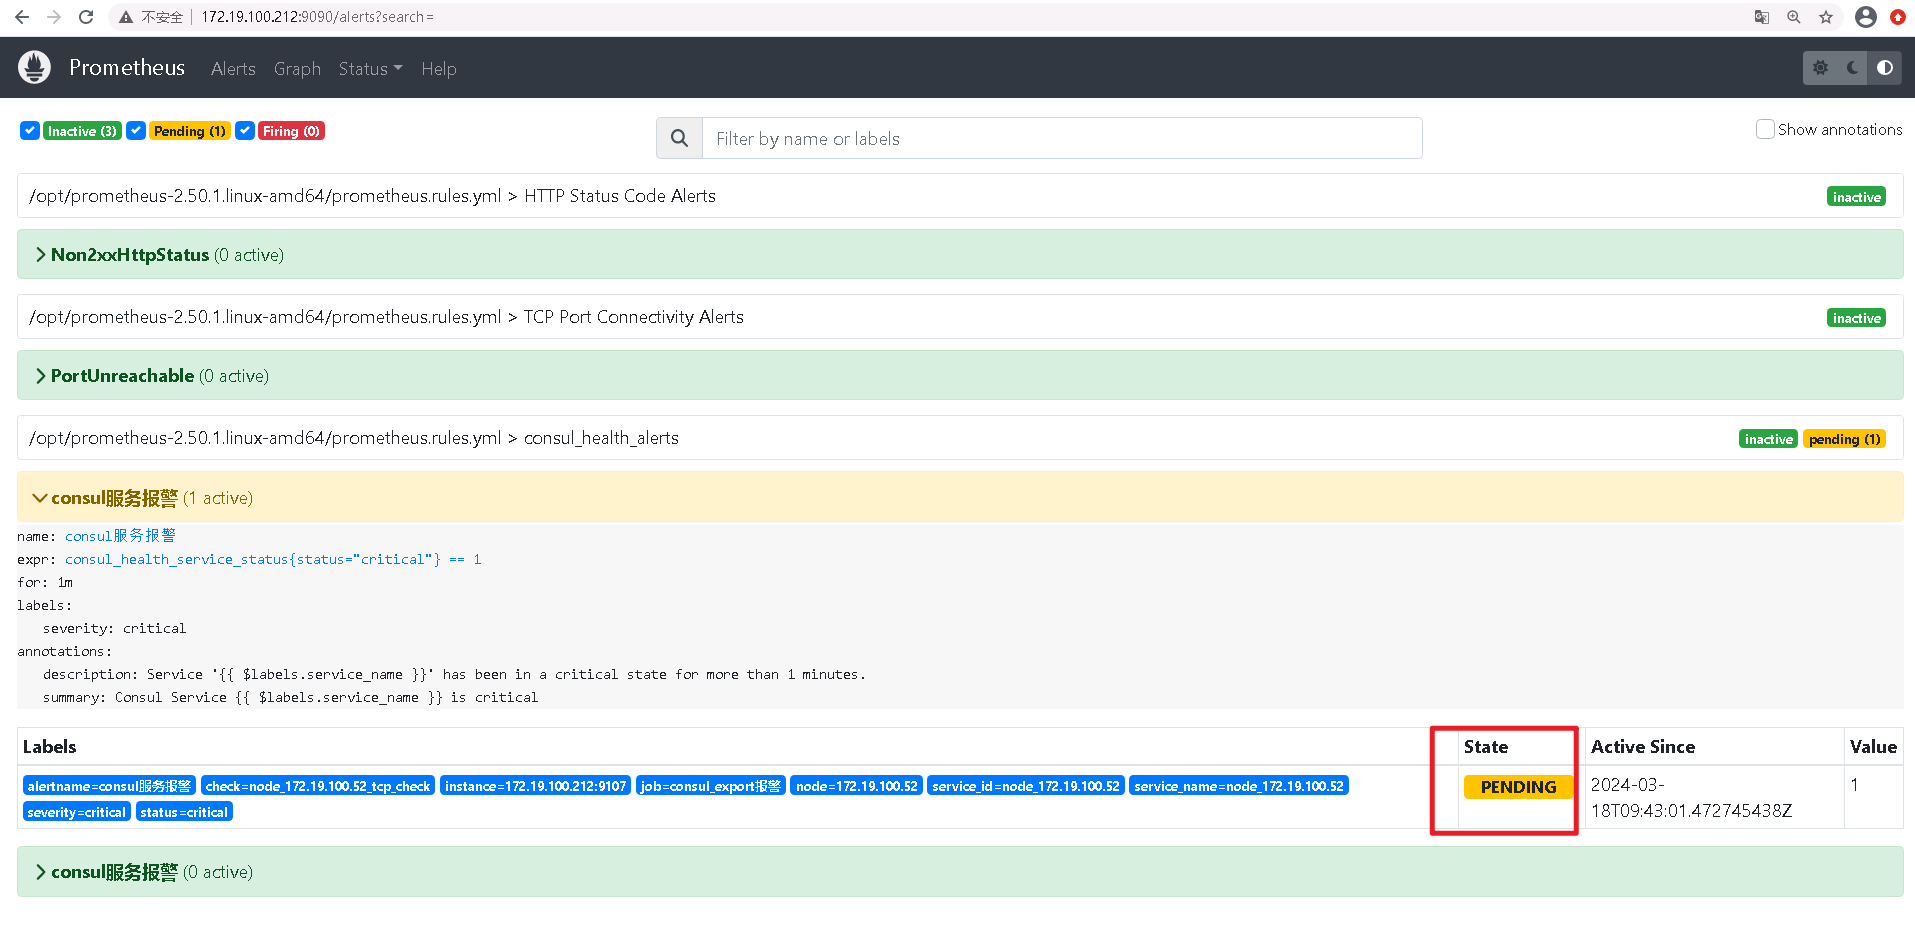
2、prometheus alert进入pending状态
如果1分钟内,状态没有改变,则变为firing
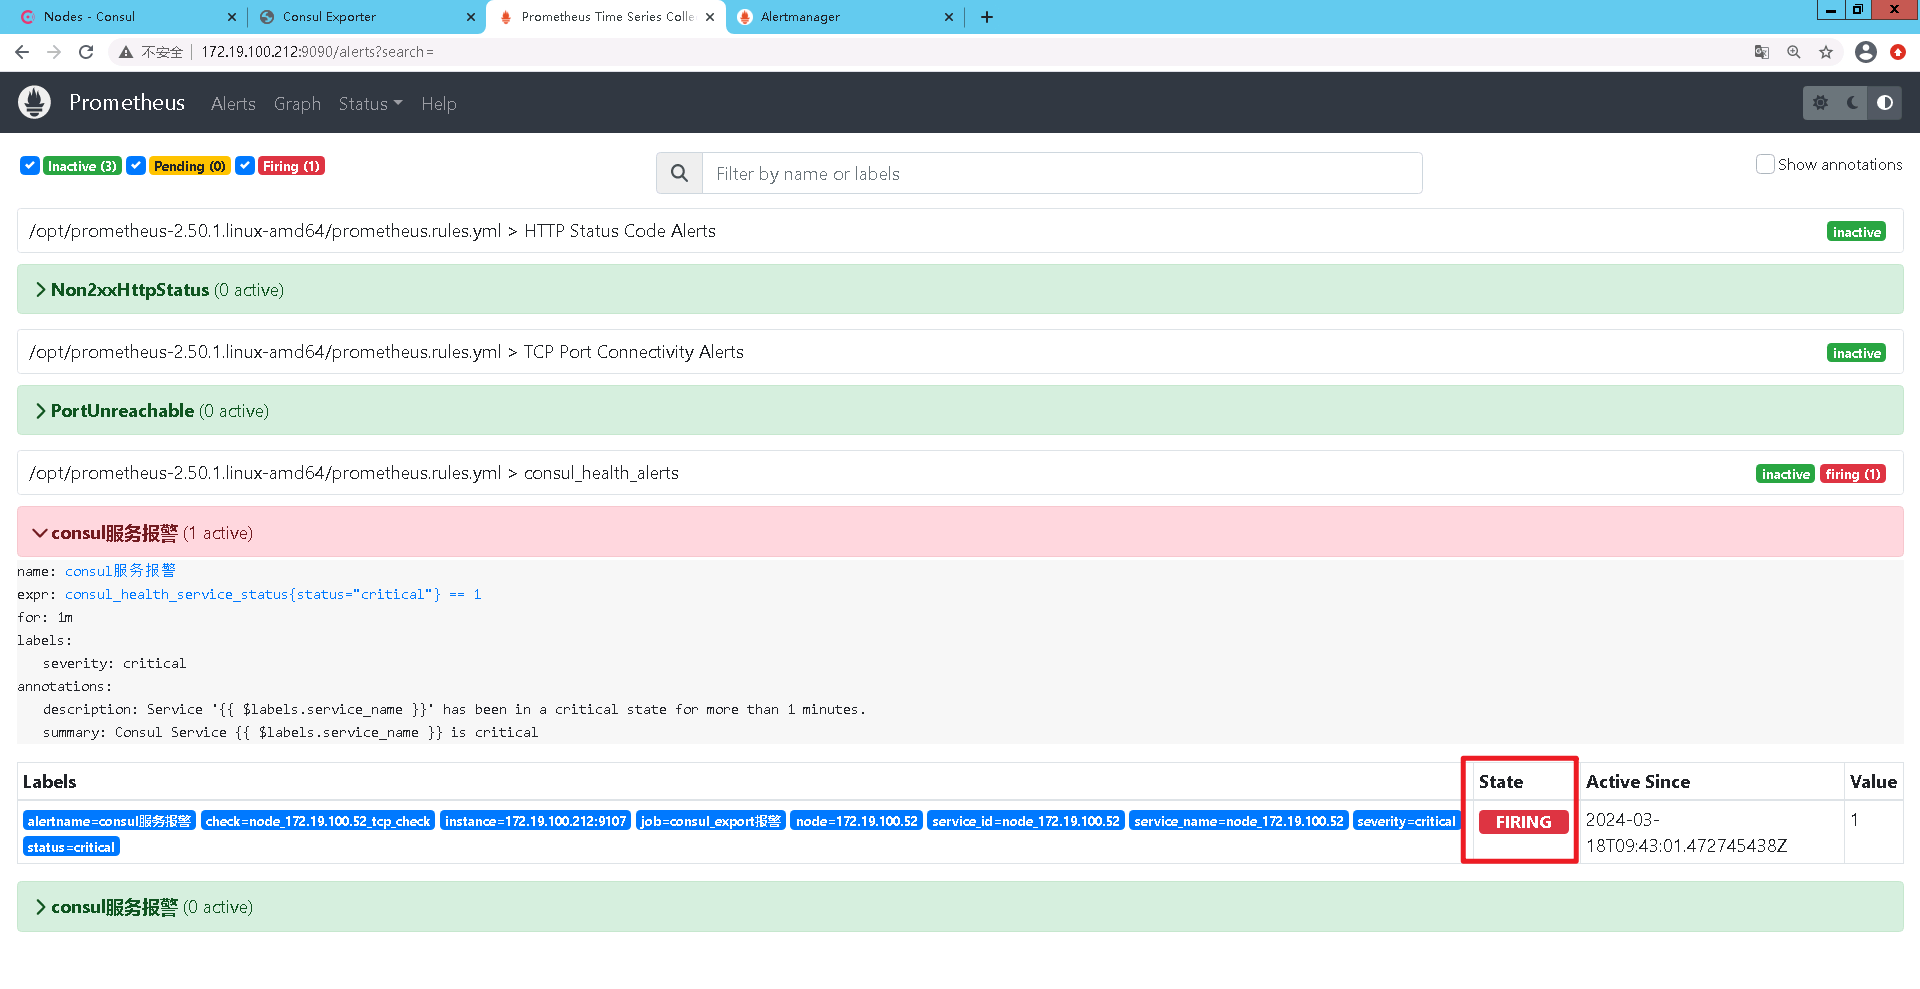
3、prometheus alert进入firing状态
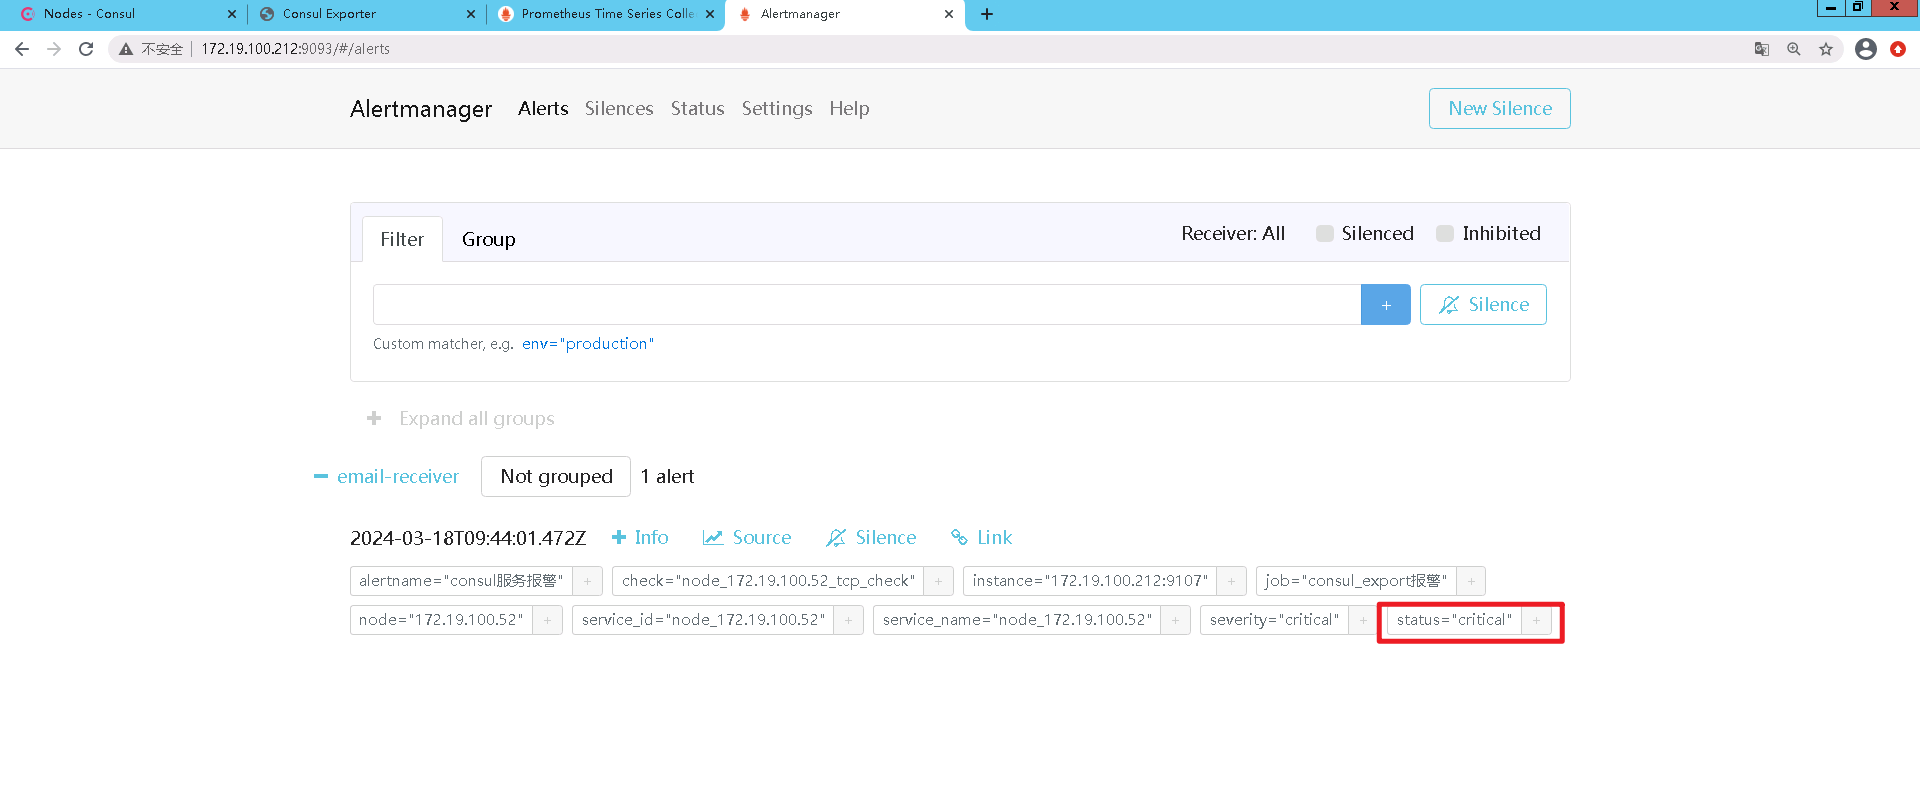
4、alertmanager平台触发报警
将通过alertmanager.yml中route规则发送邮件。
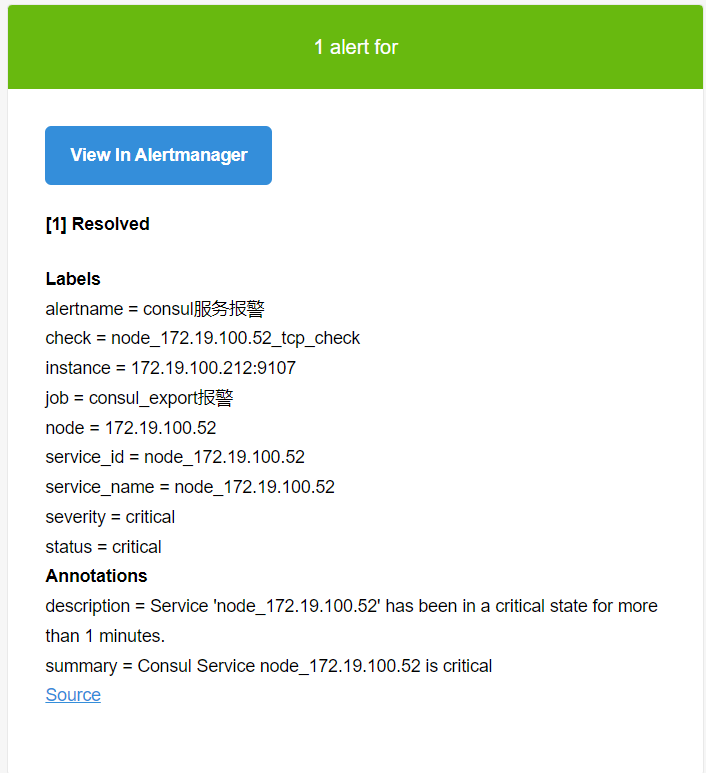
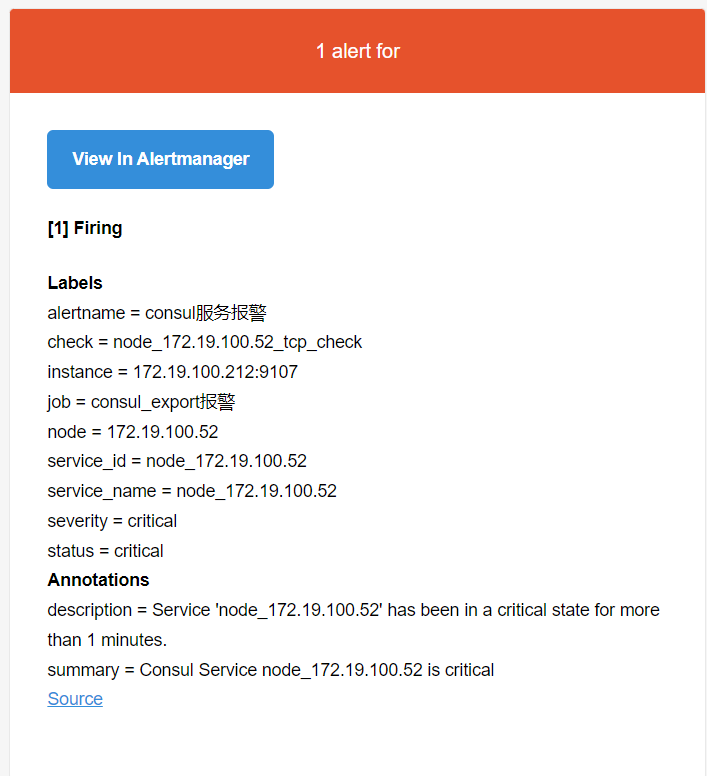
5、接收到报警邮件
6、报警解除,收到解除邮件
Systemctl start node_exporter后报警消失,发送接触报警邮件,至此,报警链条完美闭环。