- A+
所属分类:Web前端
vue3 甘特图(二):gantt时间轴切换
1.固定时间轴缩放级别
gantt.config.scale_unit = "month"; //时间轴单位 gantt.config.step = 1;//单位数 gantt.config.date_scale = "%Y年%M";//时间轴展现方式
2.动态改变时间轴缩放
点击不同按钮,切换时间轴状态 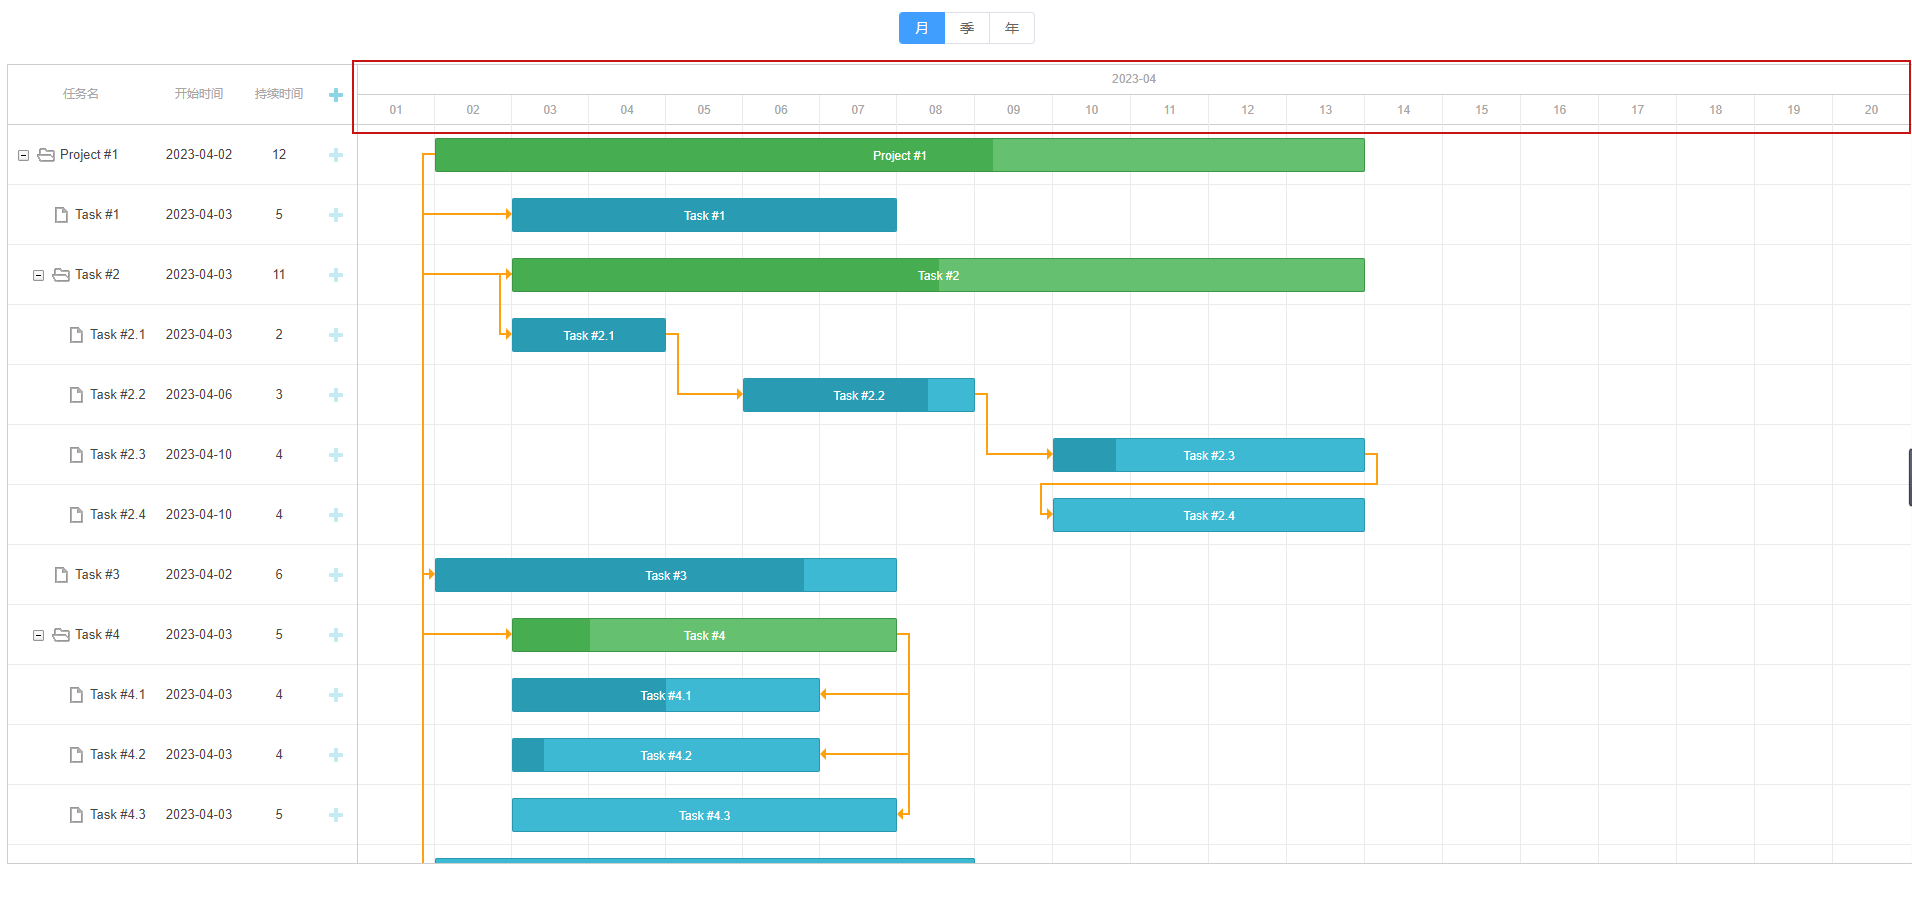
2.1 配置时间轴参数
levels里可配置多个级别。
scales展示时间轴对应多少行,下的format可自定展现方式,css属性方法可判断是否为轴,给周末添加上高亮属性。
const zoomConfig = { levels: [ { name: 'day', scale_height: 60, scales: [{ unit: 'day', step: 1, format: '%d %M' }] }, { name: 'week', scale_height: 60, scales: [ { unit: 'week', step: 1, format: function (date) { let dateToStr = gantt.date.date_to_str('%m-%d') let endDate = gantt.date.add(date, -6, 'day') let weekNum = gantt.date.date_to_str('%W')(date) //第几周 return dateToStr(endDate) + ' 至 ' + dateToStr(date) } }, { unit: 'day', step: 1, format: '%d', // + "周%D" css: function (date) { if (date.getDay() == 0 || date.getDay() == 6) { return 'day-item weekend weekend-border-bottom' } else { return 'day-item' } } } ] }, { name: 'month', scale_height: 60, min_column_width: 18, scales: [ { unit: 'month', format: '%Y-%m' }, { unit: 'day', step: 1, format: '%d', css: function (date) { if (date.getDay() == 0 || date.getDay() == 6) { return 'day-item weekend weekend-border-bottom' } else { return 'day-item' } } } ] }, { name: 'quarter', height: 60, min_column_width: 110, scales: [ { unit: 'quarter', step: 1, format: function (date) { let yearStr = new Date(date).getFullYear() + '年' let dateToStr = gantt.date.date_to_str('%M') let endDate = gantt.date.add(gantt.date.add(date, 3, 'month'), -1, 'day') return yearStr + dateToStr(date) + ' - ' + dateToStr(endDate) } }, { unit: 'week', step: 1, format: function (date) { let dateToStr = gantt.date.date_to_str('%m-%d') let endDate = gantt.date.add(date, 6, 'day') let weekNum = gantt.date.date_to_str('%W')(date) return dateToStr(date) + ' 至 ' + dateToStr(endDate) } } ] }, { name: 'year', scale_height: 50, min_column_width: 150, scales: [ { unit: 'year', step: 1, format: '%Y年' }, { unit: 'month', format: '%Y-%m' } ] } ] }
2.2 初始化时间轴配置
gantt.ext.zoom.init(zoomConfig) //配置初始化扩展 gantt.ext.zoom.setLevel('month') //切换到指定的缩放级别
2.3 改变时间轴
const changeTime = () => { gantt.ext.zoom.setLevel(data.timeState) }
2.4 周末或特殊日期高亮
.weekend { background: #ff9e2f; color: #fff; }
3. 完整示例代码
<template> <section class="my-gantt"> <div class="time-box"> <el-radio-group v-model="data.timeState" @change="changeTime"> <el-radio-button v-for="(time, t_index) in data.timeList" :key="t_index" :label="time.code" size="default" border >{{ time.name }}</el-radio-button > </el-radio-group> </div> <div id="gantt_here" class="gantt-container"></div> </section> </template> <script setup> import { reactive, toRefs, onBeforeMount, onMounted, watchEffect, defineExpose } from 'vue' import { gantt } from 'dhtmlx-gantt' import 'dhtmlx-gantt/codebase/dhtmlxgantt.css' import demoData from './ganttData.json' const data = reactive({ timeList: [ // { // name: "周", // code: "week", // }, { name: '月', code: 'month' }, { name: '季', code: 'quarter' }, { name: '年', code: 'year' } ], timeState: 'month' }) const zoomConfig = { levels: [ { name: 'day', scale_height: 60, scales: [{ unit: 'day', step: 1, format: '%d %M' }] }, { name: 'week', scale_height: 60, scales: [ { unit: 'week', step: 1, format: function (date) { let dateToStr = gantt.date.date_to_str('%m-%d') let endDate = gantt.date.add(date, -6, 'day') let weekNum = gantt.date.date_to_str('%W')(date) //第几周 return dateToStr(endDate) + ' 至 ' + dateToStr(date) } }, { unit: 'day', step: 1, format: '%d', // + "周%D" css: function (date) { if (date.getDay() == 0 || date.getDay() == 6) { return 'day-item weekend weekend-border-bottom' } else { return 'day-item' } } } ] }, { name: 'month', scale_height: 60, min_column_width: 18, scales: [ { unit: 'month', format: '%Y-%m' }, { unit: 'day', step: 1, format: '%d', css: function (date) { if (date.getDay() == 0 || date.getDay() == 6) { return 'day-item weekend weekend-border-bottom' } else { return 'day-item' } } } ] }, { name: 'quarter', height: 60, min_column_width: 110, scales: [ { unit: 'quarter', step: 1, format: function (date) { let yearStr = new Date(date).getFullYear() + '年' let dateToStr = gantt.date.date_to_str('%M') let endDate = gantt.date.add(gantt.date.add(date, 3, 'month'), -1, 'day') return yearStr + dateToStr(date) + ' - ' + dateToStr(endDate) } }, { unit: 'week', step: 1, format: function (date) { let dateToStr = gantt.date.date_to_str('%m-%d') let endDate = gantt.date.add(date, 6, 'day') let weekNum = gantt.date.date_to_str('%W')(date) return dateToStr(date) + ' 至 ' + dateToStr(endDate) } } ] }, { name: 'year', scale_height: 50, min_column_width: 150, scales: [ { unit: 'year', step: 1, format: '%Y年' }, { unit: 'month', format: '%Y-%m' } ] } ] } //初始化甘特图 const initGantt = () => { gantt.config.grid_width = 350 gantt.config.add_column = false //添加符号 //时间轴图表中,如果不设置,只有行边框,区分上下的任务,设置之后带有列的边框,整个时间轴变成格子状。 gantt.config.autofit = false gantt.config.row_height = 60 gantt.config.bar_height = 34 // gantt.config.fit_tasks = true //自动延长时间刻度,以适应所有显示的任务 gantt.config.auto_types = true //将包含子任务的任务转换为项目,将没有子任务的项目转换回任务 // gantt.config.xml_date = '%Y-%m-%d' //甘特图时间数据格式 gantt.config.readonly = true //是否只读 gantt.i18n.setLocale('cn') //设置语言 gantt.init('gantt_here') //初始化 gantt.parse(demoData) //填充数据 gantt.ext.zoom.init(zoomConfig) //配置初始化扩展 gantt.ext.zoom.setLevel('month') //切换到指定的缩放级别 } const changeTime = () => { gantt.ext.zoom.setLevel(data.timeState) } onBeforeMount(() => {}) onMounted(() => { initGantt() }) watchEffect(() => {}) defineExpose({ ...toRefs(data) }) </script> <style scoped lang="scss"> .my-gantt { height: 800px; width: 100vw; .time-box { text-align: center; margin-bottom: 20px; } ::v-deep .gantt-container { width: 100%; height: 100%; .weekend { background: #ff9e2f; color: #fff; } } } </style>