- A+
所属分类:Web前端
?在Nuxt3.0项目中用到了可视化图表?,于是我用了EChart可视化图表库。但是在官网我没有找到针对在Nuxt3.0中使用EChart的方法,于是在这里记录我的引入EChart并简单使用的步骤。需要声明的是,本文只针对在Nuxt3.0项目中使用EChart.js库的可视化图表进行讲解,不针对EChart图表的详细配置进行讲解,如需了解EChart的可视化图表详细配置参数,请查看官网手册Documentation - Apache ECharts
?第一步:下载安装vue-echarts和echarts
?安装vue-echarts包:npm i vue-echarts
?安装echarts包:npm i echarts
?tips:如果下载安装报错,可替换尝试使用:npm i vue-echarts --force和npm i echarts --force
?第二步:配置项目nuxt-config.ts文件
nuxt-config.ts文件
// https://nuxt.com/docs/api/configuration/nuxt-config export default defineNuxtConfig({ build: { transpile: [/echarts/], } }) ?第三步:新建plugins目录,并在目录下新建chart.js文件

chart.js文件:
import { use } from 'echarts/core'; // 手动导入ECharts模块以减小包的大小 import { CanvasRenderer } from 'echarts/renderers'; import { BarChart } from 'echarts/charts'; import { GridComponent, TooltipComponent } from 'echarts/components'; export default defineNuxtPlugin(() => { use([CanvasRenderer, BarChart, GridComponent, TooltipComponent]); }); ?第四步:在Test.vue页面中使用
Test.vue页面文件
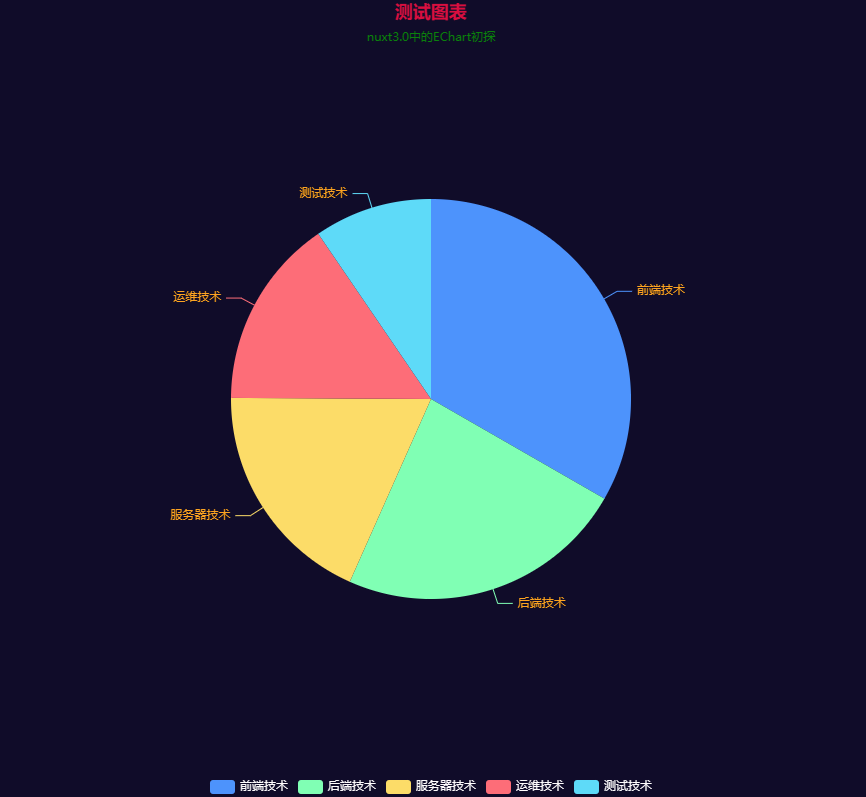
<template> <div> <client-only> <v-chart class="chart" :option="option" /> </client-only> </div> </template> <script setup lang="ts"> import { use } from 'echarts/core'; import { CanvasRenderer } from 'echarts/renderers'; import { LabelLayout } from 'echarts/features'; import { PieChart } from 'echarts/charts'; import { TitleComponent, TooltipComponent, LegendComponent, } from 'echarts/components'; import VChart, { THEME_KEY } from 'vue-echarts'; import { ref, defineComponent } from 'vue'; use([ CanvasRenderer, PieChart, TitleComponent, TooltipComponent, LegendComponent, LabelLayout ]); const option = ref({ title: { text: '测试图表', subtext: 'nuxt3.0中的EChart初探', left: 'center', textStyle: { //主标题样式 color: '#DC143C' }, subtextStyle: { //副标题样式 color: '#008000' } }, tooltip: { trigger: 'item' }, legend: { orient: 'horizontal', //图例方向 bottom: 'bottom', //图例距离底部位置 textStyle: { color: "#FFFDFE" }, //图例字体颜色 }, series: [ { name: '技术量', type: 'pie', radius: '50%', label: { color: '#FFA500' }, data: [ { value: 1048, name: '前端技术' }, { value: 735, name: '后端技术' }, { value: 580, name: '服务器技术' }, { value: 484, name: '运维技术' }, { value: 300, name: '测试技术' } ] } ] }); </script> <style scoped> .chart { height: 800px; } </style> ???至此,我们在Nuxt3.0项目中使用EChart图表的需求就实现啦~???
???tips:我使用的是Vue3.0的 setup语法糖的写法,如果没有用语法糖写法的小伙伴可以参考如下代码,其中唯一的区别就是在Test.vue页面文件中的用法不同:
<template> <div> <client-only> <v-chart class="chart" :option="option" /> </client-only> </div> </template> <script> //注意这里没有使用setup语法糖 import { use } from 'echarts/core'; import { CanvasRenderer } from 'echarts/renderers'; import { PieChart } from 'echarts/charts'; import { TitleComponent, TooltipComponent, LegendComponent, } from 'echarts/components'; import VChart, { THEME_KEY } from 'vue-echarts'; import { ref, defineComponent } from 'vue'; use([ CanvasRenderer, PieChart, TitleComponent, TooltipComponent, LegendComponent, ]); export default defineComponent({ name: 'HelloWorld', components: { VChart, }, provide: { [THEME_KEY]: 'dark', }, setup() { const option = ref({ title: { text: '测试图表', subtext: 'nuxt3.0中的EChart初探', left: 'center', textStyle: { //主标题样式 color: '#DC143C', }, subtextStyle: { //副标题样式 color: '#008000', }, }, tooltip: { trigger: 'item', }, legend: { orient: 'horizontal', //图例方向 bottom: 'bottom', //图例距离底部位置 textStyle: { color: '#FFFDFE' }, //图例字体颜色 }, series: [ { name: '技术量', type: 'pie', radius: '50%', label: { color: '#FFA500', }, data: [ { value: 1048, name: '前端技术' }, { value: 735, name: '后端技术' }, { value: 580, name: '服务器技术' }, { value: 484, name: '运维技术' }, { value: 300, name: '测试技术' }, ], }, ], }); return { option }; }, }); </script> <style scoped> .chart { height: 800px; } </style> 效果图: