- A+
一:背景
1. 讲故事
前段时间有位朋友说他的程序 CPU 出现了暴涨现象,由于程序是买来的,所以问题就比较棘手了,那既然找到我,就想办法帮朋友找出来吧,分析下来,问题比较经典,有必要和大家做一下分享。
二:WinDbg 分析
1. CPU 真的爆高吗
一直关注这个系列的朋友应该知道,用 !tp 验证即可。
0:161> !tp CPU utilization: 81% Worker Thread: Total: 486 Running: 486 Idle: 0 MaxLimit: 8191 MinLimit: 24 Work Request in Queue: 0 -------------------------------------- Number of Timers: 1 -------------------------------------- Completion Port Thread:Total: 6 Free: 1 MaxFree: 48 CurrentLimit: 6 MaxLimit: 1000 MinLimit: 24 果然 CPU =81% ,并且当前的 481 个工作线程全部打满,以经验看可能是遇到锁什么的,不过还是先从是否触发 GC 看起。
2. 是触发 GC 了吗?
要查看是否触发 GC,可以用 !t -special 看看是否有 SuspendEE 字样。
0:161> !t -special ThreadCount: 604 UnstartedThread: 0 BackgroundThread: 587 PendingThread: 0 DeadThread: 11 Hosted Runtime: no OSID Special thread type 29 2e74 DbgHelper 30 1014 GC SuspendEE 31 4a84 GC 32 4a48 GC ... 52 37c0 GC 53 47a0 GC 54 4620 Finalizer 55 1aa4 ProfilingAPIAttach ... 从卦中看,30号线程果然挂了 SuspendEE,并且还是一个 GC 线程,接下来切过去看看此时 GC 正在做什么?
0:161> ~~[1014]s eax=00000000 ebx=0724fc10 ecx=00000000 edx=00000000 esi=00000000 edi=0724fc10 eip=77ddf02c esp=0724fbd0 ebp=0724fc34 iopl=0 nv up ei pl nz ac po nc cs=0023 ss=002b ds=002b es=002b fs=0053 gs=002b efl=00000212 ntdll!NtDelayExecution+0xc: 77ddf02c c20800 ret 8 0:030> k # ChildEBP RetAddr 00 0724fc34 758345da ntdll!NtDelayExecution+0xc 01 0724fc34 738a74eb KERNELBASE!SleepEx+0x8a 02 0724fc78 73a0f710 clr!EESleepEx+0x59 03 0724fc78 73a0f809 clr!SVR::gc_heap::mark_steal+0x27c 04 0724fcd0 73a17930 clr!SVR::gc_heap::mark_phase+0x3d0 05 0724fd0c 73a17dc9 clr!SVR::gc_heap::gc1+0xf2 06 0724fd5c 73a174a1 clr!SVR::gc_heap::garbage_collect+0x746 07 0724fd78 73a10d7e clr!SVR::gc_heap::gc_thread_function+0x14a 08 0724fd98 73a10d0f clr!SVR::gc_heap::gc_thread_stub+0x72 09 0724fdac 750e62c4 clr!GCThreadStub+0x1f 0a 0724fdc0 77dd1f69 kernel32!BaseThreadInitThunk+0x24 0b 0724fe08 77dd1f34 ntdll!__RtlUserThreadStart+0x2f 0c 0724fe18 00000000 ntdll!_RtlUserThreadStart+0x1b 从卦中的 gc_thread_function 函数看,这是一个阻塞版的 GC 线程,当前正处于 mark_phase 标记阶段,并且还在抢其他 GC 线程的活,有点意思。。。
既然是触发了 GC ,那就看下触发了哪一代以及什么原因触发的。
0:030> x clr!*gc_heap::settings* 73f15da8 clr!WKS::gc_heap::settings = <no type information> 73f13520 clr!SVR::gc_heap::settings = <no type information> 0:030> dp 73f13520 73f13520 00002df0 00000002 00000001 00000001 73f13530 00000000 00000000 00000000 00000000 73f13540 00000000 00000000 00000000 00000000 73f13550 00000000 00000000 00000005 00000001 73f13560 00000000 00000000 00000000 00000001 73f13570 00000000 0000005a 00000000 00000001 73f13580 05f71b40 86b2ee2e 00040000 00000001 73f13590 00000002 00002000 00000002 00000000 从卦中的 00000002 和 00000005 可知,当前触发的是 2代 GC,原因是 5,那 5 是什么意思? 可以看下 clr 中的 gc_reason 即可。
enum gc_reason { reason_alloc_soh = 0, reason_induced = 1, reason_lowmemory = 2, reason_empty = 3, reason_alloc_loh = 4, reason_oos_soh = 5, reason_oos_loh = 6, reason_induced_noforce = 7, // it's an induced GC and doesn't have to be blocking. reason_gcstress = 8, // this turns into reason_induced & gc_mechanisms.stress_induced = true reason_lowmemory_blocking = 9, reason_induced_compacting = 10, reason_lowmemory_host = 11, reason_pm_full_gc = 12, // provisional mode requested to trigger full GC reason_lowmemory_host_blocking = 13, reason_bgc_tuning_soh = 14, reason_bgc_tuning_loh = 15, reason_bgc_stepping = 16, reason_max }; 也就是上面的 reason_oos_soh,表示当前的小对象堆中的段空间满了,那是不是呢? 可以用 !eeheap -gc 看下托管堆。
0:030> !eeheap -gc Number of GC Heaps: 24 ------------------------------ Heap 0 (06d00138) generation 0 starts at 0xe8a380ec generation 1 starts at 0xe8a380e0 generation 2 starts at 0x07311000 ephemeral segment allocation context: (0xe8a380f8, 0xe8a38104) segment begin allocated size 07310000 07311000 0830fd5c 0xffed5c(16772444) a86a0000 a86a1000 a969fd10 0xffed10(16772368) e8a10000 e8a11000 e8a380f8 0x270f8(159992) Large object heap starts at 0x1f311000 segment begin allocated size 1f310000 1f311000 1f4cafb0 0x1b9fb0(1810352) Heap Size: Size: 0x21deb14 (35515156) bytes. ------------------------------ ... Heap 22 (06d76910) generation 0 starts at 0xbfd5d228 generation 1 starts at 0xbfd5ce20 generation 2 starts at 0x1d311000 ephemeral segment allocation context: (0xbfd5d234, 0xbfd5d240) segment begin allocated size 1d310000 1d311000 1e30fe64 0xffee64(16772708) bed60000 bed61000 bfd5d234 0xffc234(16761396) Large object heap starts at 0x2a311000 segment begin allocated size 2a310000 2a311000 2a311010 0x10(16) Heap Size: Size: 0x1ffb0a8 (33534120) bytes. ... ------------------------------ GC Heap Size: Size: 0x2f6f6d18 (795831576) bytes. 可以看到,heap 上很多都是 segment=16M 打满状态,停。。。为什么 segment 只有 16M ,出现了一个重大线索。
3. 重大线索解读
一个 Server 版的 GC,拥有高达 24 个逻辑核,居然只有 16M 的 segment,这么小的 segment,很容易被一些快进快出的大内存操作给打满,也就更容易造成 GC 触发,而且还是 Full GC,版本信息如下:
0:030> !eeversion 4.7.3416.0 retail Server mode with 24 gc heaps SOS Version: 4.7.3416.0 retail build 接下来到线程栈上找找有没有快进快出的大内存操作。
4. 寻找大内存操作
既然有快进快出的操作,在 GC 触发时肯定还会躺在 托管堆 上,我们就从这里入手。
0:030> !dumpheap -stat Statistics: MT Count TotalSize Class Name ... 06cd1750 638727 15899642 Free 30361270 171401 19196912 xxxx.Entities.ProductInventoryLog 30360f90 537090 32225400 xxxx.Entities.ProductInventoryEpcDetail 30f9a148 171404 67875600 System.Data.Entity.Core.Objects.StateManagerValue[] 3036074c 694875 97282500 xxxx.Entities.ProductBorrow 727efd60 8419815 394836372 System.String Total 14577631 objects Fragmented blocks larger than 0.5 MB: Addr Size Followed by 9b0bf500 0.5MB 9b141878 System.Byte[] 从托管堆看,有不少的类对象,接下来抽一个 xxxx.Entities.ProductInventoryEpcDetail 看下引用,然后查根对象的 size。
0:161> !gcroot a8780ecc Thread 40b8: df90d330 715d143a System.Linq.Enumerable+<JoinIterator>d__38`4[[System.__Canon, mscorlib],[System.__Canon, mscorlib],[System.__Canon, mscorlib],[System.__Canon, mscorlib]].MoveNext() esi: -> 090eeba4 System.Linq.Enumerable+<JoinIterator>d__38`4[] ... -> a8780e80 xxxx.Entities.ProductInventoryEpcDetail[] -> a8780ecc xxxx.Entities.ProductInventoryEpcDetail Found 1 unique roots (run '!GCRoot -all' to see all roots). 其实这个引用链特别长,用 !objsize 090eeba4 显示对象大小,一直都是卡住中,size 肯定不小, 接下来我们切入到 40b8 看下这个方法,可以发现一个非常复杂的 EF 写法,又是 outer,又是 inner,又要再关联,截图如下:
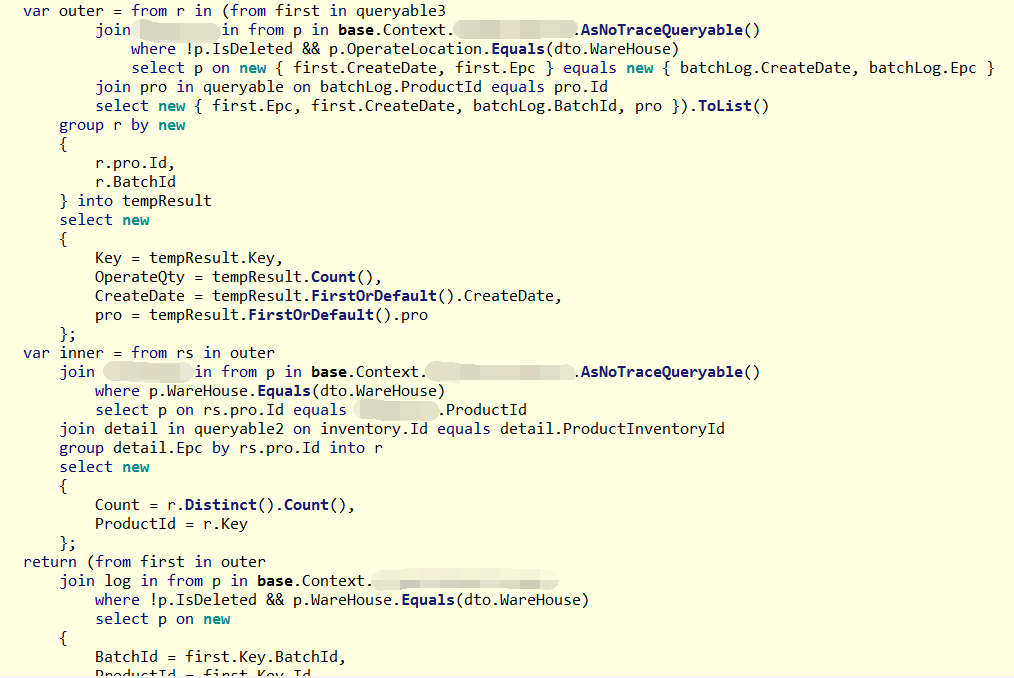
到这里大对象操作终于找到了,我发现还有其他方法也有一些 EF 复杂操作,就不一一列举了。
三:总结
这个 dump 给我们两个教训:
-
当 sql 很复杂时,千万不要用 EF 去写,这中间会产生多少个临时对象你真的搞不清楚,你也hold不住,建议直接改成 sql,简单粗暴。
-
程序尽量用 64bit 部署,否则你的 segment 会太小,太容易让 GC 上头了。