- A+
一:背景
1. 讲故事
上个月有位朋友加wx告知他的程序有挂死现象,询问如何进一步分析,截图如下:

看这位朋友还是有一定的分析基础,可能玩的少,缺乏一定的分析经验,当我简单分析之后,我发现这个dump挺有意思的, CPU,内存,挂死 三样全占,程序悲惨莫过于此。。。
既然找到我,我得想办法化解他的痛苦???,由易到难我们逐一分析这三样都是因为什么原因所致?
二:三高分析
1. 挂死原因
根据 40+ 的dump分析经验,挂死大多是由于某种情况导致线程卡死,导致后续请求堆积在 threadpool 中,要想验证,可以使用 !tp 命令查看线程池队列。
0:000> !tp CPU utilization: 81% Worker Thread: Total: 65 Running: 65 Idle: 0 MaxLimit: 32767 MinLimit: 64 Work Request in Queue: 2831 Unknown Function: 00007ffffcba1750 Context: 0000022ab04d4a58 Unknown Function: 00007ffffcba1750 Context: 0000022ab03e4ce8 ... Unknown Function: 00007ffffcba1750 Context: 0000022ab825ec88 Unknown Function: 00007ffffcba1750 Context: 0000022ab825a458 Unknown Function: 00007ffffcba1750 Context: 0000022ab8266500 Unknown Function: 00007ffffcba1750 Context: 0000022ab8268198 Unknown Function: 00007ffffcba1750 Context: 0000022ab826cb00 Unknown Function: 00007ffffcba1750 Context: 0000022ab8281578 -------------------------------------- Number of Timers: 0 -------------------------------------- Completion Port Thread:Total: 2 Free: 2 MaxFree: 128 CurrentLimit: 2 MaxLimit: 32767 MinLimit: 64 可以很明显的看到线程池队列有 2831 个任务堆积,这就导致新进来的请求无法得到处理,所以就出现了挂死现象,接下来就来看看这些线程都干嘛去了,为啥效率那么低,可以用 ~*e !clrstack 调出所有线程栈,截图如下:

扫了一遍后,发现有很多的 System.Net.HttpWebRequest.GetResponse() 方法,有经验的朋友应该知道,这又是一个经典的同步http请求过慢导致的程序处理不及的挂死,有些朋友可能好奇,能不能把网址给我扒出来,可以是可以,用 !dso 命令即可。
000000D2FBD3B840 0000023269e85698 System.Text.UTF8Encoding 000000D2FBD3B850 00000236e9dd2cb8 System.String application/x-www-form-urlencoded 000000D2FBD3B870 0000023269e85698 System.Text.UTF8Encoding 000000D2FBD3B9A8 00000231aa221a38 System.String uSyncAppxxx 000000D2FBD3B9B8 00000231aa201a70 System.String VToken={0}&Vorigin={1}&QueryJson={2} 000000D2FBD3B9C0 00000231aa202200 System.String http://xxx.xxx.com/API/xxx/BusinessCardFolder/Connector/xxx/GetPageList 我去,这url还是一个外网地址,??了,本身同步方式就慢,这地址更是雪上加霜哈。。。难怪不卡死?
2. cpu爆高分析
从上面的 !tp 输出中也看出来了,当前 cpu = 81% ,那为什么会这么高呢?根据经验大概就是 lock锁,GC触发,死循环等情况,可以用排除法。
- 是 lock 锁吗?
可以用命令 !syncblk 看一下同步块表。
0:000> !syncblk Index SyncBlock MonitorHeld Recursion Owning Thread Info SyncBlock Owner 212 0000023ef3cdd028 3 1 0000023ef40efa40 8d70 209 000002396ad93788 System.Object ----------------------------- Total 297 CCW 3 RCW 4 ComClassFactory 0 Free 139 从输出看,lock 锁没什么问题,接下来用 !mlocks 命令查看下其他类型的锁,看看有没有什么新发现。
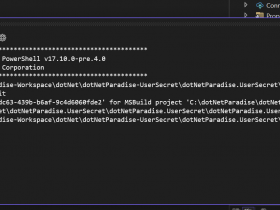
0:000> !mlocks Examining SyncBlocks... Scanning for ReaderWriterLock(Slim) instances... Scanning for holders of ReaderWriterLock locks... Scanning for holders of ReaderWriterLockSlim locks... Examining CriticalSections... ClrThread DbgThread OsThread LockType Lock LockLevel ------------------------------------------------------------------------------ ... 0x49 209 0x8d70 thinlock 000002396ad9ba90 (recursion:0) 0x49 209 0x8d70 thinlock 000002396ad9baa8 (recursion:0) 0x49 209 0x8d70 thinlock 000002396ad9bac0 (recursion:0) 0x49 209 0x8d70 thinlock 000002396ad9bad8 (recursion:0) 0x49 209 0x8d70 thinlock 000002396ad9baf0 (recursion:0) 0x49 209 0x8d70 thinlock 000002396ad9bb08 (recursion:0) 0x49 209 0x8d70 thinlock 000002396ad9bb20 (recursion:0) 0x49 209 0x8d70 thinlock 000002396ad9bb38 (recursion:0) 0x49 209 0x8d70 thinlock 000002396ad9bb50 (recursion:0) 0x49 209 0x8d70 thinlock 000002396ad9bb68 (recursion:0) 0x49 209 0x8d70 thinlock 000002396ad9bb80 (recursion:0) 0xe 152 0x8e68 thinlock 0000023669f7e428 (recursion:0) 0x41 208 0x8fb4 thinlock 00000235e9f6e8d0 (recursion:0) 0x17 161 0x9044 thinlock 00000238ea94db68 (recursion:0) 0x16 159 0x911c thinlock 000002392a03ed40 (recursion:0) 0x47 206 0x9264 thinlock 000002322af08e28 (recursion:0) 我去,发现有大量的 thinlock,而且 DbgThread=209 线程居然有 1000 +,截图如下:

有些朋友可能不知道什么叫 thinlock,简单来说,它就是一种耗cpu的内旋锁,类似 SpinLock,接下来随便抽一个对象,查看它的 !gcroot 。
0:000> !gcroot 000002396ad9ba48 Thread 2580: 000000d2fb0bef10 00007ff806945ab3 System.Threading.ExecutionContext.RunInternal(System.Threading.ExecutionContext, System.Threading.ContextCallback, System.Object, Boolean) rbp-80: 000000d2fb0bef50 -> 0000023769dd4008 System.Threading.Thread -> 0000023269e776b8 System.Runtime.Remoting.Contexts.Context -> 0000023269e773b8 System.AppDomain ... -> 0000023269ee1e00 System.Threading.TimerCallback -> 0000023269ed2d30 System.Web.Caching.CacheExpires -> 0000023269ed2c78 System.Web.Caching.CacheSingle -> 0000023269ed2ce0 System.Collections.Hashtable -> 000002372ab91d90 System.Collections.Hashtable+bucket[] -> 00000239ab32fd10 System.Web.Caching.CacheEntry -> 000002396ad93748 System.Collections.Concurrent.ConcurrentDictionary`2[[System.String, mscorlib],[xxx].Application.Entity.BaseManage.UserRelationEntity, xxx.Application.Entity]] -> 00000239ab2a8248 System.Collections.Concurrent.ConcurrentDictionary`2+Tables[[System.String, mscorlib],[xxx.Application.Entity.BaseManage.UserRelationEntity, xxx.Application.Entity]] -> 000002396ad96b80 System.Object[] -> 000002396ad9ba48 System.Object 从输出信息看,这个 thinlock 来自于 ConcurrentDictionary 字典内部,接下来我们 dump 出这个字典,使用 !mdt 命令。
0:148> !mdt 000002396ad93748 000002396ad93748 (System.Collections.Concurrent.ConcurrentDictionary`2[[System.String, mscorlib],[xxx.Application.Entity.BaseManage.UserRelationEntity, xxx.Application.Entity]]) m_tables:00000239ab2a8248 (System.Collections.Concurrent.ConcurrentDictionary`2+Tables[[System.String, mscorlib],[xxx.Application.Entity.BaseManage.UserRelationEntity, xxx.Application.Entity]]) m_comparer:NULL (System.Collections.Generic.IEqualityComparer`1[[System.__Canon, mscorlib]]) m_growLockArray:true (System.Boolean) m_keyRehashCount:0x0 (System.Int32) m_budget:0x213 (System.Int32) m_serializationArray:NULL (System.Collections.Generic.KeyValuePair`2[[System.__Canon, mscorlib],[System.__Canon, mscorlib]][]) m_serializationConcurrencyLevel:0x0 (System.Int32) m_serializationCapacity:0x0 (System.Int32) 0:148> !mdt 00000239ab2a8248 00000239ab2a8248 (System.Collections.Concurrent.ConcurrentDictionary`2+Tables[[System.String, mscorlib],[xxx.Application.Entity.BaseManage.UserRelationEntity, xxx.Application.Entity]]) m_buckets:0000023e9a2477e8 (System.Collections.Concurrent.ConcurrentDictionary`2+Node[[System.String, mscorlib],[xxx.Application.Entity.BaseManage.UserRelationEntity, xxx.Application.Entity]][], Elements: 543997) m_locks:000002396ad96b80 (System.Object[], Elements: 1024) m_countPerLock:00000239aa8472c8 (System.Int32[], Elements: 1024) m_comparer:0000023269e782b8 (System.Collections.Generic.GenericEqualityComparer`1[[System.String, mscorlib]]) 从上面信息看,这个字典有 54.3 w 条记录,为啥这么大,而且还有 1024 个 lock,有点意思,我们扒一下源码看看。

从源码看,内部确实有一个 lock[] 数组,那到底是什么操作引发了遍历 locks[],要想寻找答案,可以在所有线程栈上寻找 ConcurrentDictionary 关键词。
OS Thread Id: 0x2844 (163) Child SP IP Call Site 000000d2fb83abb8 00007ff80a229df8 [GCFrame: 000000d2fb83abb8] 000000d2fb83aca0 00007ff80a229df8 [GCFrame: 000000d2fb83aca0] 000000d2fb83acd8 00007ff80a229df8 [HelperMethodFrame: 000000d2fb83acd8] System.Threading.Monitor.Enter(System.Object) 000000d2fb83add0 00007ff80693ea56 System.Collections.Concurrent.ConcurrentDictionary`2[[System.__Canon, mscorlib],[System.__Canon, mscorlib]].AcquireLocks(Int32, Int32, Int32 ByRef) 000000d2fb83ae20 00007ff806918ef2 System.Collections.Concurrent.ConcurrentDictionary`2[[System.__Canon, mscorlib],[System.__Canon, mscorlib]].AcquireAllLocks(Int32 ByRef) 000000d2fb83ae60 00007ff8069153f9 System.Collections.Concurrent.ConcurrentDictionary`2[[System.__Canon, mscorlib],[System.__Canon, mscorlib]].GetValues() 000000d2fb83aee0 00007ff7ae17d8ec xxx.Util.DataHelper.ToEnumerable[[System.__Canon, mscorlib],[System.__Canon, mscorlib]](System.Collections.Concurrent.ConcurrentDictionary`2<System.__Canon,System.__Canon>) 000000d2fb83af20 00007ff7ad125241 xxx.Application.Code.CacheHelper.GetCaches[[System.__Canon, mscorlib],[System.__Canon, mscorlib]](System.String) 000000d2fb83afa0 00007ff7ad12513b xxx.Application.Code.CacheHelper.GetCaches[[System.__Canon, mscorlib]](System.String) 000000d2fb83b000 00007ff7b10199e5 xxx.Application.Cache.CacheHelper.GetUserRelations() 从线程栈上看,发现了有近20处如上的代码,可以看出程序在调用 GetCaches 方法的时候触发了 ConcurrentDictionary 的lock锁从而卡住,接下来我们看一下 xxx.Application.Cache.CacheHelper.GetUserRelations() 源码到底做了什么?
public static IEnumerable<UserRelationEntity> GetUserRelations() { return xxx.Application.Code.CacheHelper.GetCaches<UserRelationEntity>("xxx.BaseManage-UserRelation"); } protected static IEnumerable<T> GetCaches<T>(string cacheKeyName) { return GetCaches<T, string>(cacheKeyName); } private static IEnumerable<T> GetCaches<T, TKey>(string cacheKeyName) { return GetConcurrentDictionaryCache<T, TKey>(cacheKeyName)?.ToEnumerable(); } public static IEnumerable<T> ToEnumerable<TKey, T>(this ConcurrentDictionary<TKey, T> dics) { return dics.Values; } 从源码逻辑看,程序每次调用缓存最终都会调用 dics.Values , 我很好奇它的框架逻辑是什么样的? 截图如下:

大家有没有发现,每次 dict.Values 时都要执行 1024 次 Monitor.Enter(locks[i], ref lockTaken);, 也就是 1024 次的内旋锁,这就是cpu高的一个关键因素。
3. 内存爆高原因
最后一个问题是内存为啥会爆高? 细心的朋友应该会发现刚才那个 GetValues 中有一个奇怪的逻辑 ,我再贴一下代码:
private ReadOnlyCollection<TValue> GetValues() { int locksAcquired = 0; try { AcquireAllLocks(ref locksAcquired); int countInternal = GetCountInternal(); if (countInternal < 0) { throw new OutOfMemoryException(); } List<TValue> list = new List<TValue>(countInternal); for (int i = 0; i < m_tables.m_buckets.Length; i++) { for (Node node = m_tables.m_buckets[i]; node != null; node = node.m_next) { list.Add(node.m_value); } } return new ReadOnlyCollection<TValue>(list); } finally { ReleaseLocks(0, locksAcquired); } } 有没有发现,每一次 GetValues 时都会生成一个 54.3w 大小的新List,请注意这个 list 是新生成的,不是 ConcurrentDictionary 上的引用,这就很坑了,每调用一次,LOH上就会来一个这么大的List,你说内存暴增不暴增???
三:总结
总的来说,这苦逼的三高有下面两个因素造成。
- 使用了同步的 HttpRequest 方式并使用了外网url导致程序挂死。
优化措施:使用异步方式
- 巨坑的 ConcurrentDictionary.Values 导致 内存,cpu 爆高。
我想很多朋友都没想到: ConcurrentDictionary.Values 有这么大的一个坑,这就让我联想起了线程不安全的 Dictionary.Values 是怎么做的?
public ValueCollection Values { [__DynamicallyInvokable] get { if (values == null) { values = new ValueCollection(this); } return values; } } public sealed class ValueCollection { public ValueCollection(Dictionary<TKey, TValue> dictionary) { if (dictionary == null) { ThrowHelper.ThrowArgumentNullException(ExceptionArgument.dictionary); } this.dictionary = dictionary; } } 可以很明显的看到它并没有生成新的list,所以优化措施如下:
- 拒绝使用 ConcurrentDictionary.Values,采用
lock + Dictionary。 - 如果硬要用 ConcurrentDictionary ,请将 Query 条件送下去,而不是使用 Values 做全量拉取再查询,减少内存无畏占用。
最后上一个小彩蛋,将分析结果给了这位朋友之后,朋友想让我上门分析,第一次遇到。。。太猝不及防啦???