- A+
所属分类:Web前端
1、安装 highcharts
npm install highcharts --save 2、页面引用
// 引入 import Highcharts from 'highcharts/highcharts-gantt.src.js' // 引入拖拽 import factory from 'highcharts/modules/draggable-points.js' factory(Highcharts) 3、封装组件
<!-- * @Descripttion: 新甘特图 * @version: 0.0.1 * @Author: PengShuai * @Date: 2023-01-12 13:20:44 * @LastEditors: PengShuai * @LastEditTime: 2023-02-01 15:00:55 --> <template> <div class="BaseNewGantt"> <div id="container"></div> </div> </template> <script> import Highcharts from 'highcharts/highcharts-gantt.src.js' import factory from 'highcharts/modules/draggable-points.js' factory(Highcharts) export default { name: 'BaseNewGantt', data() { return { isShow: true, tableConfig: [], } }, props: { // 甘特图配置 ganttConfig: { type: Object, default: () => { return { data: [], columnsConfig: [], } }, }, }, mounted() {}, methods: { // 页面初始化 init() { Highcharts.setOptions({ global: { useUTC: false, // 不使用utc时间 }, // 默认都是英文的,这里做了部分中文翻译 lang: { noData: '暂无数据', months: [ '一月', '二月', '三月', '四月', '五月', '六月', '七月', '八月', '九月', '十月', '十一月', '十二月', ], shortMonths: [ '一月', '二月', '三月', '四月', '五月', '六月', '七月', '八月', '九月', '十月', '十一月', '十二月', ], weekdays: ['日', '一', '二', '三', '四', '五', '六'], buttons: [ { type: 'month', count: 1, text: '月' }, { type: 'month', count: 3, text: '季度' }, { type: 'month', count: 6, text: '半年' }, { type: 'ytd', text: 'YTD' }, { type: 'year', count: 1, text: '年' }, { type: 'all', text: '所有' }, ], rangeSelectorZoom: '范围', }, }) this.getGantt() }, getGantt() { const _this = this const day = 1000 * 60 * 60 * 24 const map = Highcharts.map // 获取数据源 let series = this.ganttConfig.data // 左侧表格配置 this.columnsConfig = [] if (this.ganttConfig.tableConfig.length > 0) { this.ganttConfig.tableConfig.forEach((item) => { let obj = { title: { text: item.title, }, categories: map(series, function (s) { return s[item.labels] }), } this.columnsConfig.push(obj) }) } Highcharts.ganttChart('container', { plotOptions: { series: { animation: true, dragDrop: { draggableX: true, // 是否横向拖动 draggableY: false, // 是否纵向拖动 dragPrecisionX: day, }, dataLabels: { enabled: true, format: '{point.title}', style: { cursor: 'default', opacity: _this.isShow ? 0 : 1, pointerEvents: 'none', }, }, allowPointSelect: true, point: { events: { dragStart: _this.onDragStart, drag: _this.onDrag, drop: _this.onDrop, select: _this.onHandleSelect, }, }, }, }, yAxis: { type: 'category', grid: { enabled: true, borderColor: 'rgba(0,0,0,0.3)', borderWidth: 1, columns: _this.columnsConfig, }, }, xAxis: [ { currentDateIndicator: true, grid: { borderWidth: 1, // 右侧表头边框宽度 cellHeight: 0, // 右侧日期表头高度 }, labels: { format: '{value:%d}日', }, }, { labels: { format: '{value:%Y年-%m月}', }, }, ], // 提示信息 tooltip: { formatter: function () { return `<div> ${this.point.title}<br/> 开始时间: ${_this.$library.common.formatDate( new Date(this.point.start), 'YYYY-MM-DD', )}<br/> 结束时间: ${_this.$library.common.formatDate( new Date(this.point.end), 'YYYY-MM-DD', )}<br/> </div>` }, }, navigator: { enabled: true, series: { type: 'gantt', pointPlacement: 0.5, pointPadding: 0.25, }, yAxis: { min: 0, max: 6, reversed: true, categories: [], }, }, series: series, // 显示滚动条 scrollbar: { enabled: true, }, // 顶部筛选按钮 rangeSelector: { enabled: true, selected: 0, buttons: [ { type: 'month', count: 1, text: '月' }, { type: 'month', count: 3, text: '季度' }, { type: 'month', count: 6, text: '半年' }, { type: 'ytd', text: 'YTD' }, { type: 'year', count: 1, text: '年' }, { type: 'all', text: '所有' }, ], }, // // 去掉右下角版权信息 credits: { enabled: false, }, }) }, // 拖动开始 onDragStart(e) {}, // 拖动 onDrag(e) {}, // 拖动停止 onDrop(e) { this.$emit('onDragStop', e.target.options) }, // 选择事件 onHandleSelect(e) { this.$emit('onHandleSelect', e.target.options) console.log(e) }, // 是否显示标题 onShowTitle() { // 标题过长 隐藏 更改文字透明度 this.isShow = !this.isShow // 重新加载 this.getGantt() }, }, } </script> <style lang="less" scoped> .BaseNewGantt { height: calc(100% - 70px); overflow: auto; } </style> 4、组件使用
<base-gantt ref="gantt" :ganttConfig="ganttConfig" @onDragStop="onDragStop" @onHandleSelect="onHandleSelect"> </base-gantt> data中配置
// 甘特图配置 ganttConfig: { // 数据源 data: [], // 左侧表格列配置 tableConfig: [ { title: '设备名称', labels: 'machineName', }, { title: '设备编码', labels: 'machineNo', }, ], }, 事件
// 拖动停止 onDragStop(option) {}, // 甘特图选中 onHandleSelect(option) { this.selectGanttRowData = option }, 5、实例
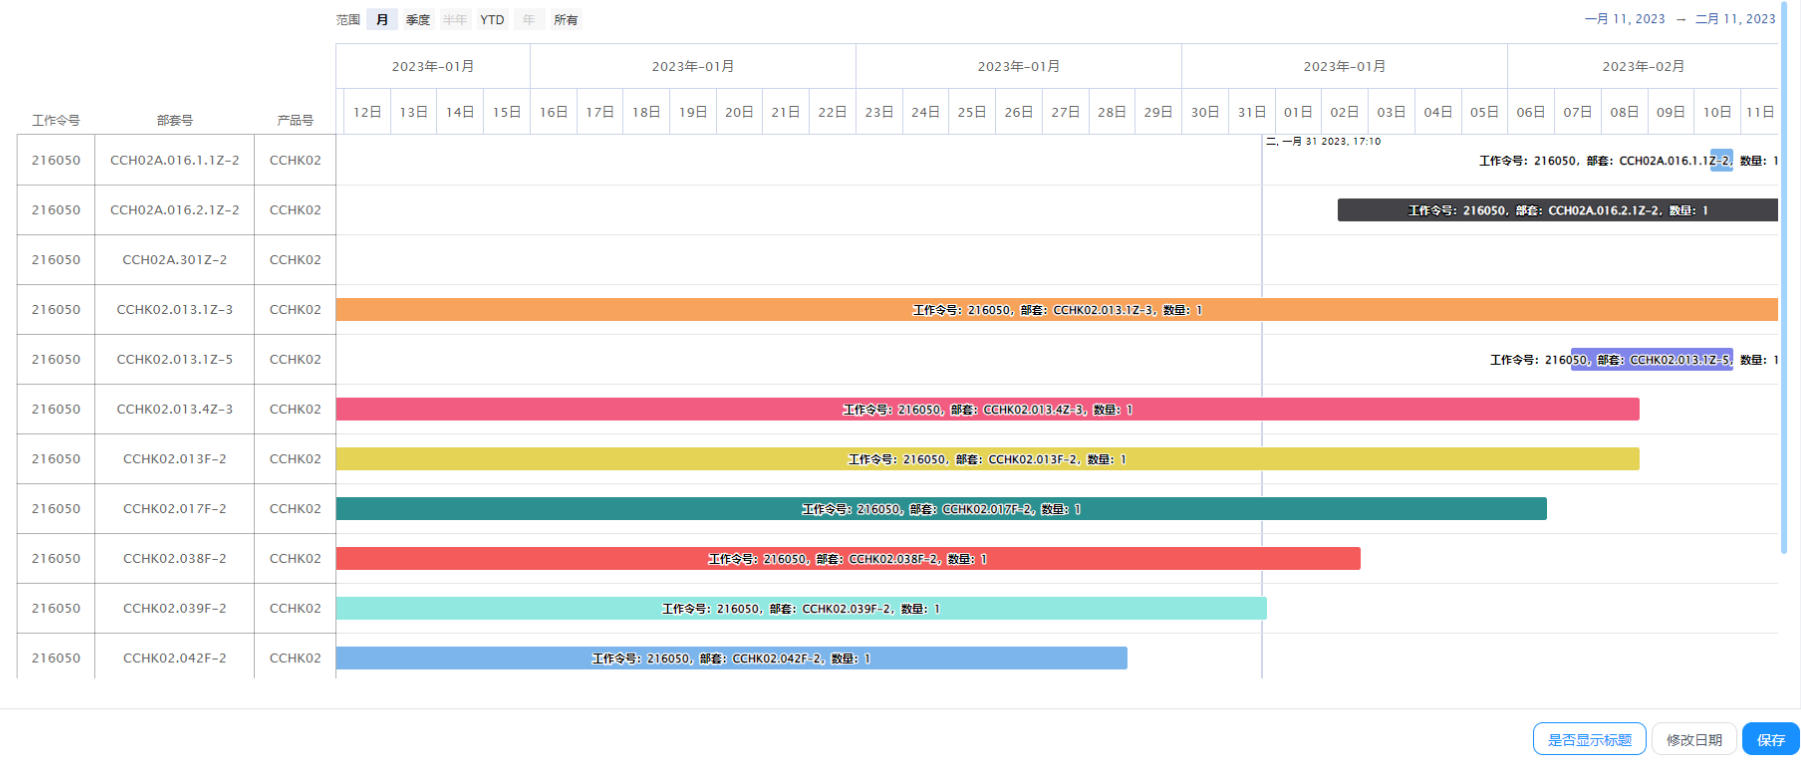
6、官网地址
https://www.hcharts.cn/
演示地址
https://www.hcharts.cn/demo/gantt