- A+
MiniProfiler 是一款性能分析的轻量级程序,可以基于action(request)记录每个阶段的耗时时长,还是可以显示访问数据库时的SQL等。
企鹅号:877617006
本篇主要介绍.Net Core 3.1下如何使用Swagger集成MiniProfiler来对我们的WebAPI接口进行监控。
安装Nuget
Install-Package MiniProfiler.AspNetCore.Mvc Install-Package MiniProfiler.EntityFrameworkCore MiniProfiler.EntityFrameworkCore 用来监控EF Core生成的SQL
配置
在startup.cs 中配置服务ConfigureServices
services.AddMiniProfiler(options => { options.RouteBasePath = "/profiler"; }).AddEntityFramework(); 激活中间件,启用MiniProfiler服务,放在UseEndpoints方法之前。
app.UseMiniProfiler(); 配置Swagger页面
- 先下载自定义Swagger页面 https://github.com/xuke353/swaggerui/blob/master/index.html。
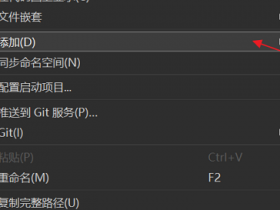
将该文件放到API层的根目录下,设置文件属性为【嵌入的资源】

在Startup.cs文件中,我们需要修改UseSwaggerUI中间件的配置
app.UseSwaggerUI(c => { c.IndexStream = () => GetType().GetTypeInfo().Assembly.GetManifestResourceStream("AdmBoots.Api.index.html"); c.RoutePrefix = string.Empty; c.SwaggerEndpoint("/swagger/v1/swagger.json", "My API V1"); }); 注意:这里AdmBoots.Api是项目的命名空间名
当前这个时候还不能使用,我们还需要在 Swagger的index.html中进行配置,以便它能在 Swagger 中使用。
重点来了
我们首先需要获取用于显示MiniProfiler的html代码片段,随便写个控制器,使用MiniProfiler的API输出一下就可以了。
[HttpGet] public IActionResult GetCounts() { var html = MiniProfiler.Current.RenderIncludes(_accessor.HttpContext); return Ok(html.Value); } 
你也可以将var html = MiniProfiler.Current.RenderIncludes(_accessor.HttpContext);随便找个地方写一下,然后通过断点的方式获取html代码片段。

然后我们将生成的内容拷贝出来粘贴在Swagger的index.html顶部
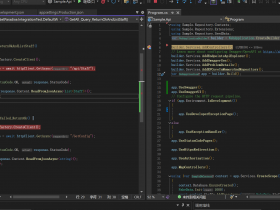
<!-- HTML for static distribution bundle build --> <script async="async" id="mini-profiler" src="/profiler/includes.min.js?v=4.2.1+b27bea37e9" data-version="4.2.1+b27bea37e9" data-path="/profiler/" data-current-id="142f3c02-c5d7-42e0-be9e-2a45e46d727a" data-ids="64b457a1-275e-4bfa-9b2f-e5bd5385a80f,142f3c02-c5d7-42e0-be9e-2a45e46d727a" data-position="Left" data-scheme="Light" data-authorized="true" data-max-traces="15" data-toggle-shortcut="Alt+P" data-trivial-milliseconds="2.0" data-ignored-duplicate-execute-types="Open,OpenAsync,Close,CloseAsync"></script> <!DOCTYPE html> <html lang="en"> <head> <meta charset="UTF-8"> <title>%(DocumentTitle)</title> ........ ........ 重新启动项目,Swagger文档页面的左上角就出现了一个小的面板,当请求接口之后,会显示出当前请求的分析数据。(如果项目启动后,左上角小面板没出来,点请求接口后就会出来了)

这样我们就可以查看我们接口的耗时及SQL了。这里的SQL还是为我们拼接好参数的,非常的方便。
注意事项
- 不要在网上随便找个MiniProfiler的HTML代码片段就拷贝到index.html中使用,这样是不会成功的,因为拷贝来的的版本号和我们所引用Nuget的版本号并不一致。
- MiniProfiler.Current.RenderIncludes(_accessor.HttpContext)中的_accessor.HttpContext是通过依赖注入IHttpContextAccessor接口获取的。IHttpContextAccessor需要在Startup.cs中进行注册。
依赖注入
private readonly IHttpContextAccessor _accessor; public ChartController(IHttpContextAccessor accessor) { _accessor = accessor; } 在Startup.cs中将IHttpContextAccessor注入容器
services.AddSingleton<IHttpContextAccessor, HttpContextAccessor>();