- A+
所属分类:Web前端
@
提示:本文仅供学习交流,请勿用于非法活动!
前言
本文大概内容:
在官网展现图表及报表(含导出)
一、使用highcharts前后端交互展示图表,及使用报表导出
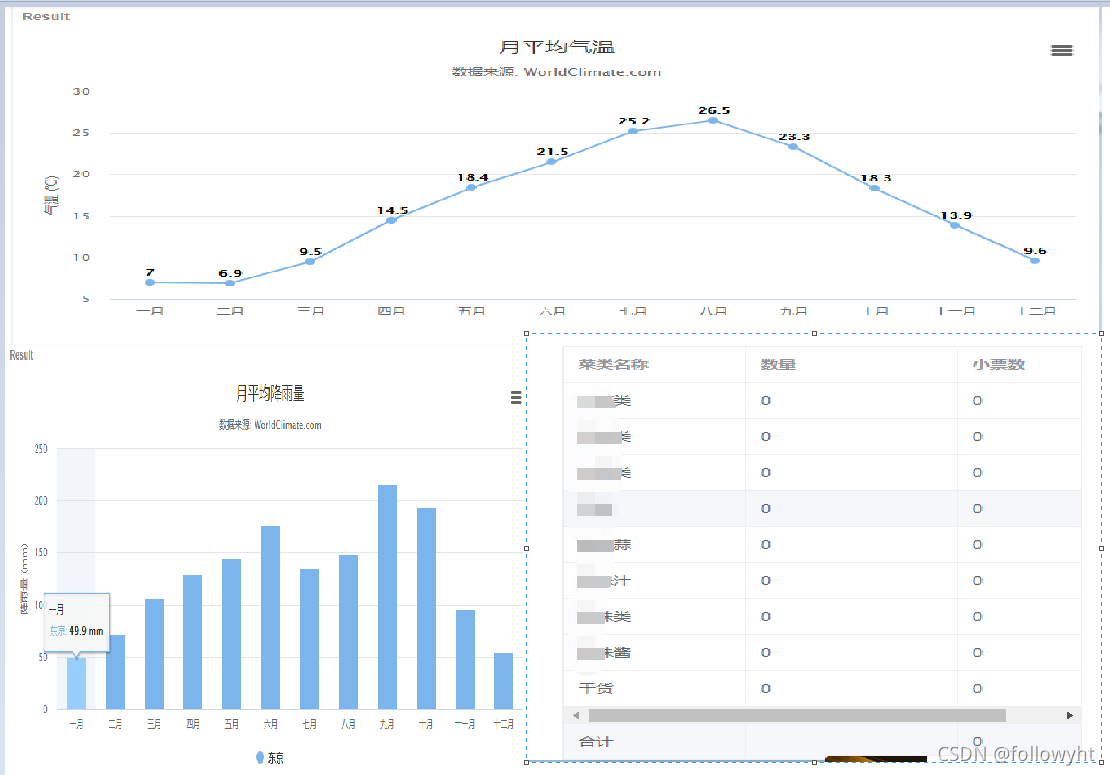
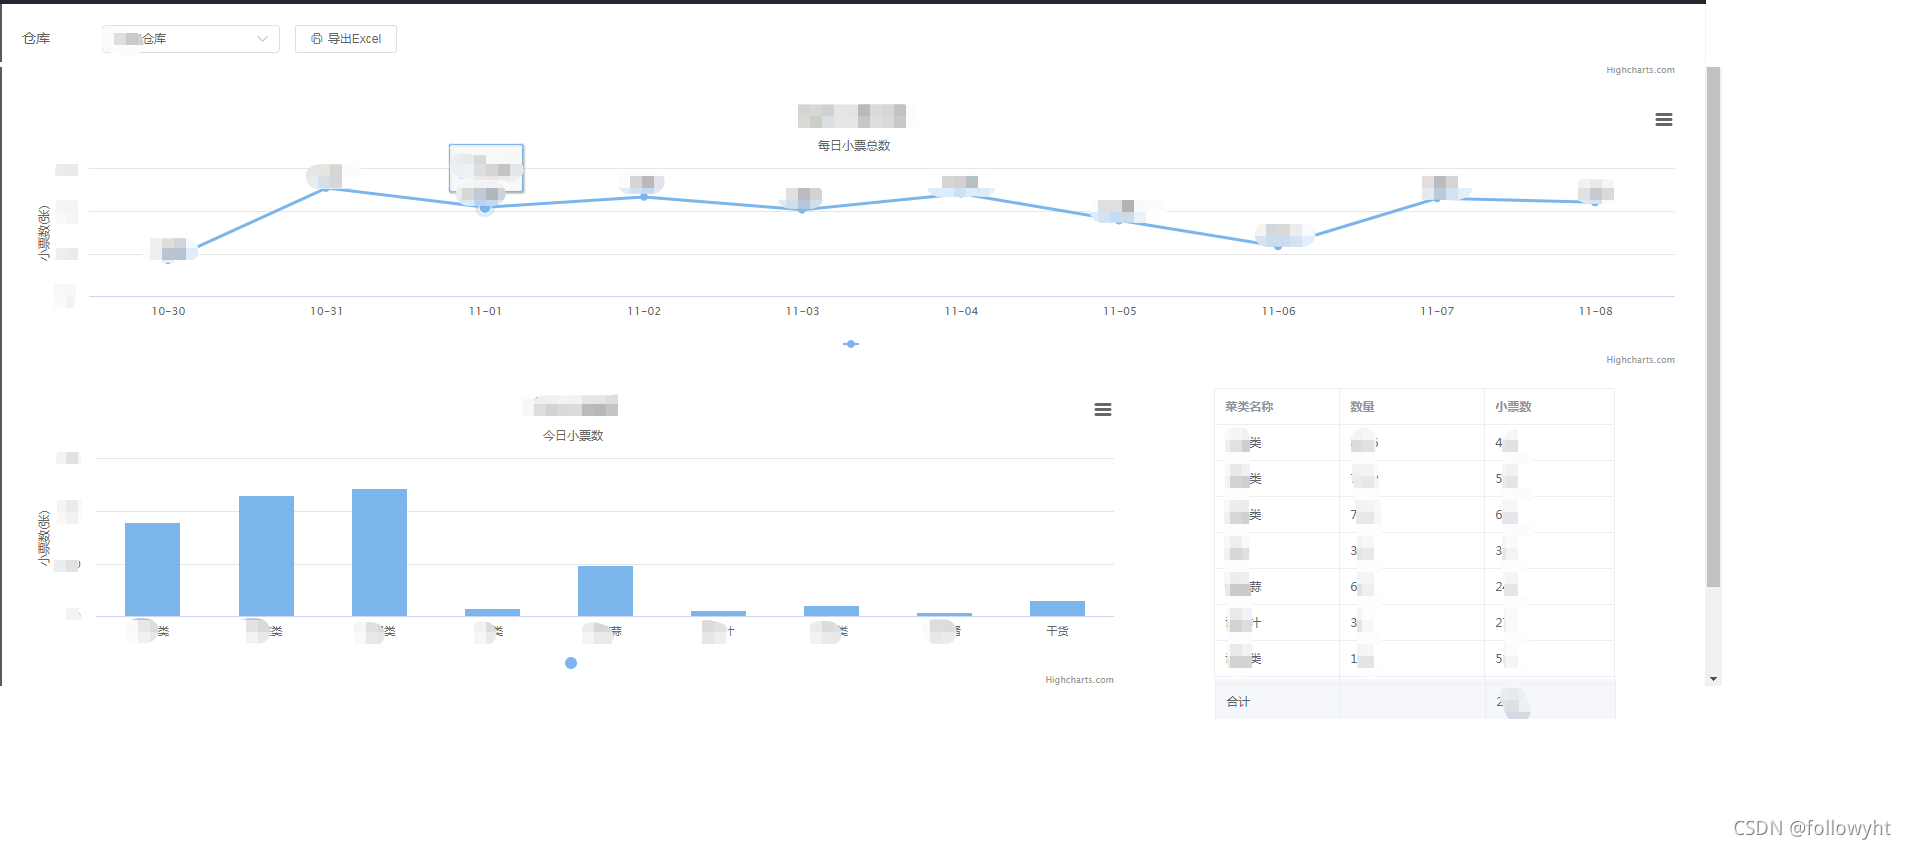
如下图,我们在首页如何将折线图、柱状图结合报表,并实现根据不同的仓库实时刷新不同的数据,最后可以选择导出图表及报表。
二、实现思路
1.图表可以选择echarts、highcharts,我们这里选择highcharts(echarts使用差不多),使用很简洁方便,并自带导出图表、打印等功能。
2.报表导出我们选择apache的HSSFWorkbook进行报表导出。
三、实现步骤
1.ElementUI代码
我们使用
代码如下:
// 前面公司的搜索框省略.... <el-row> <el-col :span="24"> <div class="grid-content bg-purple-dark"> <div style="height: 270px" id="container11"></div> </div> </el-col> </el-row> <el-row :gutter="20"> <el-col :span="16"> <div class="grid-content bg-purple-light"> <div style="height: 300px" id="container13"></div> </div> </el-col> <el-col :span="1"><div> </div></el-col> <el-col :span="6"> <div class="grid-content bg-purple-light"> <div style="height: 320px"> <el-table ref="table" :data="tableData" border size="mini" :summary-method="getSummaries" show-summary> <el-table-column prop="twoTypeName" label="菜类名称" width="125px" height="10px"></el-table-column> <el-table-column prop="quantity" label="数量" width="145px" height="10px"></el-table-column> <el-table-column prop="tickets" label="小票数" width="130px" height="10px"></el-table-column> </el-table> </div> </div> </el-col> <el-col :span="1"><div> </div></el-col> </el-row> 2.js代码:
2.1 首先要使用mounted钩子函数挂载调用图表及报表方法:
mounted() { this.moreChart1(); this.moreChart3(); this.getDayTicketsQuantity(); }, 2.2 然后要创建methods调用图表方法及报表方法
methods: { // 折线图方法 moreChart1(warehouseid) { // 这里带上仓库id,到时就可以根据不同仓库切换数据 var param = {"warehouseid":warehouseid}; axios.get("url1",{params:param}) .then(function (r) { var list = r.data.data; console.log(list); let titles = []; let values = []; // 将后端获得的数据放入折线图的下面X、Y轴定义的变量中 for(let i=0;i<list.length;i++){ titles[i] = list[i].createDay; values[i] = list[i].totalDayTickets; } var chart = Highcharts.chart('container11', { chart: { type: 'line' }, title: { text: '每日小票总数' }, subtitle: { text: '每日小票总数' }, xAxis: { categories: titles }, yAxis: { title: { text: '小票数(张)' } }, plotOptions: { line: { dataLabels: { // 开启数据标签 enabled: true }, // 关闭鼠标跟踪,对应的提示框、点击事件会失效 enableMouseTracking: true } }, series: [{ name: '', data: values },] }); }) }, // 柱状图方法 moreChart3(warehouseid) { var param = {"warehouseid":warehouseid}; axios.get("url2",{params:param}) .then(r=>{ var list = r.data.data; console.log(list); let titles = []; let values = []; for(let i=0; i<list.length;i++){ titles[i] = list[i].twoTypeName; values[i] = list[i].tickets; } var chart = Highcharts.chart('container13',{ chart: { type: 'column' }, title: { text: '今日小票数' }, subtitle: { text: '今日小票数' }, xAxis: { categories: titles, crosshair: true }, yAxis: { min: 0, title: { text: '小票数(张)' } }, tooltip: { // head + 每个 point + footer 拼接成完整的 table headerFormat: '<span style="font-size:10px">{point.key}</span><table>', pointFormat: '<tr><td style="color:{series.color};padding:0">{series.name}: </td>' + '<td style="padding:0"><b>{point.y:1f}</b></td></tr>', footerFormat: '</table>', shared: true, useHTML: true }, plotOptions: { column: { borderWidth: 0 } }, series: [{ name: '', data: values }] }); }) }, // 报表方法 getDayTicketsQuantity(warehouseid){ this.doGetData(url3,{warehouseid:warehouseid},function (r) { if(r.success){ this.tableData = r.data; } }) }, // 这里会根据页面上选择不同的仓库后触发该方法,图表和报表数据就会跟着改变 getChangeData(warehouseid){ this.moreChart1(warehouseid); this.moreChart3(warehouseid); this.getDayTicketsQuantity(warehouseid); }, } }); 2.4 着重要讲一点:下面是直接在报表多生成一行并计算总票数
getSummaries: function (param) { const { columns, data } = param; const sums = []; columns.forEach((column, index) => { var flag = false; if(index === 0){ sums[index] = '合计'; return; } if( index != 2){ sums[index] = ''; return; } const values = data.map(item => Number(item[column.property])); if(!values.every(value => isNaN(value))){ sums[index] = values.reduce((prev,curr) => { const value = Number(curr); if(!isNaN(value)){ return prev + curr; } else { return prev; } }, 0); } if(index === 2){ sums[index] = sums[index].toFixed(0); } }); return sums; }, 2.5 导出报表方法
function ticketsQuantityExportExcel(){ var str=""; if(app.filterParams.warehouseid!=null){ str+="warehouseid="+app.filterParams.warehouseid; } window.location.href = "url3"+str; }
3.后端HSSFWorkbook的java代码
@RequestMapping("/ticketsQuantityExportExcel") @ResponseBody public void ticketsQuantityExportExcel(HttpServletResponse response,String warehouseid){ try{ String docName = "今日小票及数量"; OutputStream outputStream = response.getOutputStream(); response.setContentType("application/vnd_ms-excel"); response.setHeader("Content-disposition","attachment;filename=" +new String(docName.getBytes("gb2312"),"ISO8859-1")+".xls"); List<DayTicketsQuantityDto> list = reportService.listDayTicketsQuantity(warehouseid); ticketsQuantityExcelOutPut(list,outputStream,docName); outputStream.flush(); outputStream.close(); } catch (Exception e) { logger.error("导出失败!params:" + warehouseid, e); } } public void ticketsQuantityExcelOutPut(List<DayTicketsQuantityDto> list, OutputStream ouputStream, String docName) throws IOException { // 初始化表格及字体边框 HSSFWorkbook wb = new HSSFWorkbook(); HSSFSheet sheet = wb.createSheet(docName); HSSFRow row = null; HSSFCell cell = null; sheet.setDefaultRowHeightInPoints(20); row = sheet.createRow((int) 0); HSSFCellStyle style = wb.createCellStyle(); HSSFFont font1 = wb.createFont(); font1.setFontName("宋体"); font1.setFontHeightInPoints((short) 14); font1.setBoldweight(HSSFFont.BOLDWEIGHT_BOLD); style.setAlignment(HSSFCellStyle.ALIGN_CENTER); style.setVerticalAlignment(HSSFCellStyle.VERTICAL_CENTER); style.setBorderBottom(HSSFCellStyle.BORDER_THIN); // 下边框 style.setBorderLeft(HSSFCellStyle.BORDER_THIN);// 左边框 style.setBorderTop(HSSFCellStyle.BORDER_THIN);// 上边框 style.setBorderRight(HSSFCellStyle.BORDER_THIN);// 右边框 style.setFillPattern(HSSFCellStyle.SOLID_FOREGROUND); style.setFillForegroundColor(IndexedColors.WHITE.getIndex()); style.setFont(font1); style.setAlignment(HSSFCellStyle.ALIGN_CENTER); HSSFFont font2 = wb.createFont(); font2.setFontName("宋体"); font2.setFontHeightInPoints((short) 12); HSSFCellStyle ji = wb.createCellStyle(); ji.setFillPattern(HSSFCellStyle.SOLID_FOREGROUND); ji.setFillForegroundColor(IndexedColors.WHITE.getIndex()); ji.setAlignment(HSSFCellStyle.ALIGN_CENTER); ji.setVerticalAlignment(HSSFCellStyle.VERTICAL_CENTER); ji.setBorderBottom(HSSFCellStyle.BORDER_THIN); // 下边框 ji.setBorderLeft(HSSFCellStyle.BORDER_THIN);// 左边框 ji.setBorderTop(HSSFCellStyle.BORDER_THIN);// 上边框 ji.setBorderRight(HSSFCellStyle.BORDER_THIN);// 右边框 ji.setFillPattern(HSSFCellStyle.SOLID_FOREGROUND); ji.setFont(font2); // 增加表格表头仓库名称及报表日期(报表里面没有) DayTicketsQuantityDto dto = list.get(0); if(dto!=null){ row = sheet.createRow((int)0); cell = row.createCell(0); cell.setCellValue("仓库名称"); cell.setCellStyle(style); sheet.autoSizeColumn(0); sheet.setColumnWidth(0,20*356); cell = row.createCell(1); cell.setCellValue(dto.getWarehouseName()); cell.setCellStyle(style); sheet.autoSizeColumn(0); sheet.setColumnWidth(0, 20 * 356); row = sheet.createRow((int) 1); cell = row.createCell(0); cell.setCellValue("报表日期"); cell.setCellStyle(style); sheet.autoSizeColumn(0); sheet.setColumnWidth(0, 20 * 356); cell = row.createCell(1); cell.setCellValue(dto.getCreateDay()); cell.setCellStyle(style); sheet.autoSizeColumn(0); sheet.setColumnWidth(0, 20 * 356); } // 正式构建表格正文表格并将查询的数据填充进去 String[] excelHeader = {"菜类名称","数量","小票数"}; row = sheet.createRow((int)2); for (int i = 0; i < excelHeader.length; i++) { cell = row.createCell(i); cell.setCellValue(excelHeader[i]); cell.setCellStyle(style); sheet.autoSizeColumn(i); sheet.setColumnWidth(i, 20 * 356); } if (list != null && list.size() > 0) { Integer totalTickets = 0; for (int i = 0; i < list.size(); i++) { row = sheet.createRow(i + 3); DayTicketsQuantityDto trn = list.get(i); if (trn != null) { HSSFCell cell1 = row.createCell(0); if (trn.getTwoTypeName() != null) { cell1.setCellValue(trn.getTwoTypeName()); } HSSFCell cell2 = row.createCell(1); if (trn.getQuantity() != null) { cell2.setCellValue(Integer.valueOf(trn.getQuantity())); } HSSFCell cell3 = row.createCell(2); if (trn.getTickets() != null) { cell3.setCellValue(Integer.valueOf(trn.getTickets())); totalTickets += Integer.valueOf(trn.getTickets()); } cell1.setCellStyle(ji); cell2.setCellStyle(ji); cell3.setCellStyle(ji); } } // 增加末行合计一行 row = sheet.createRow(list.size() + 3); HSSFCell cell1 = row.createCell(0); cell1.setCellValue("合计"); HSSFCell cell2 = row.createCell(1); cell2.setCellValue(""); HSSFCell cell3 = row.createCell(2); cell3.setCellValue(totalTickets); cell1.setCellStyle(ji); cell2.setCellStyle(ji); cell3.setCellStyle(ji); } wb.write(ouputStream); } }
四、最后的页面如下:
随心所往,看见未来。Follow your heart,see night!
欢迎点赞、关注、留言,一起学习、交流!